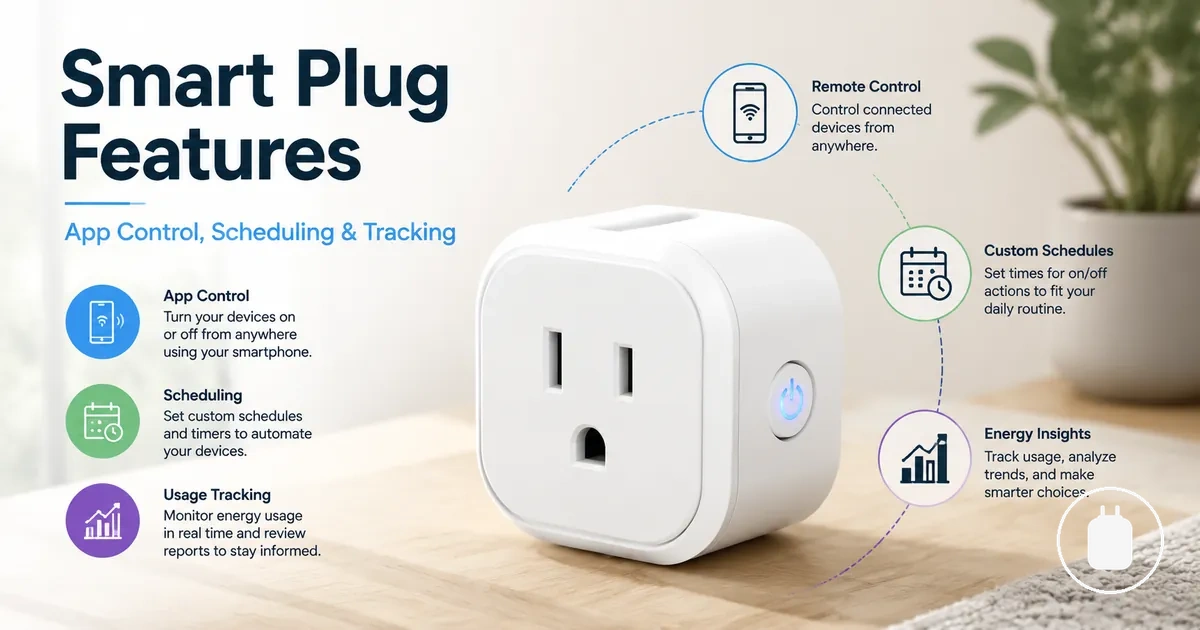
Energy Monitoring Smart Plug Features That Matter
Energy monitoring smart plug features are the functions that help users understand, control, and interpret electricity usage from a connected plug. These features can include power monitoring, app control, scheduling, usage data visibility, and safety-related signals. The value of each feature depends on the condition it helps evaluate, such as appliance usage patterns, control needs, reliability, or compatibility requirements. Features are most useful when they are judged by practical value rather than labels alone.

An energy monitoring smart plug can combine measurement, control, display, and protection features into one decision-support tool. Understanding these feature groups helps users evaluate what a plug-level monitor may provide before considering a suitable option. The category of energy monitoring smart plugs covers different approaches to tracking and managing appliance electricity use, so feature meaning matters more than individual feature names.
Feature availability and usefulness can vary by model, app support, appliance context, and connection environment. A feature that provides useful information in one situation may have different value in another setup. Features describe capability, while suitability depends on how those capabilities match the user's requirements.
Energy monitoring smart plug features can be organized by what they measure, control, display, protect, or help decide. This structure creates a clearer way to evaluate feature groups without treating the page as a product catalogue.
| Feature group | What it affects | Useful signal | Main limitation |
|---|---|---|---|
| Power monitoring | Visibility of electricity usage | Wattage, kWh, and real-time readings can help interpret appliance usage data | Measurement detail and display options can vary by model |
| App control | Remote interaction with a connected plug | Control features can support appliance routines and monitoring decisions | App functions and control options depend on available support |
| Scheduling and automation | Timing and routine-based control | Timers and schedules can help organize repeated device behaviour | Usefulness depends on appliance suitability and supported features |
| Safety signals | Risk awareness and load considerations | Overload protection, power rating, and appliance load information can support safer decisions | Safety depends on plug design, connected appliance, and operating conditions |
| Compatibility | Connection and usage fit | App support and connection features can affect monitoring continuity | Compatibility depends on model, network, and user environment |
What Energy Monitoring Features Add to a Smart Plug
Energy monitoring features are the measurement, control, and reporting functions that distinguish an energy monitoring smart plug from a basic switching plug. These features add monitoring capability by providing usage information, control options, and ways to interpret connected appliance activity. The main added capability is turning a basic switching function into a device with energy-related visibility.

Energy monitoring features can combine measurement, app visibility, automation, and safety indicators to support decisions about connected devices. The energy monitoring smart plugs category includes features that help users understand usage tracking, control options, and reporting functions beyond basic switching. These features can change a basic smart plug into a monitoring device, while usefulness depends on appliance use, app support, and model limits.
Energy monitoring features can be grouped by the type of value they provide rather than by product labels. Measurement features focus on usage information, control features focus on interaction, automation features focus on routines, and reliability signals focus on conditions that affect monitoring availability. Feature capability describes what a smart plug can provide, while the final usefulness depends on the specific setup.
- Measurement: Energy monitoring features can provide usage data and consumption information for understanding connected appliance activity.
- App visibility: Monitoring functions can display energy information through app-based tracking when supported by the model.
- Automation: Scheduling and control features can help manage repeated appliance routines through supported settings.
- Safety indicators: Features such as overload protection and power-related signals can help users consider appliance suitability and operating conditions.
- Reliability signals: Connection and reporting features can affect how consistently monitoring information is available.
Power Measurement Features Inside an Energy Monitoring Smart Plug
Power measurement features are the measurement layer that turns plug-level electricity use into readable values. An energy monitoring smart plug connects measurement types such as wattage, current, voltage, and kWh to values that help users interpret connected appliance activity. These readings create a foundation for understanding usage data and supporting decisions about electricity use.
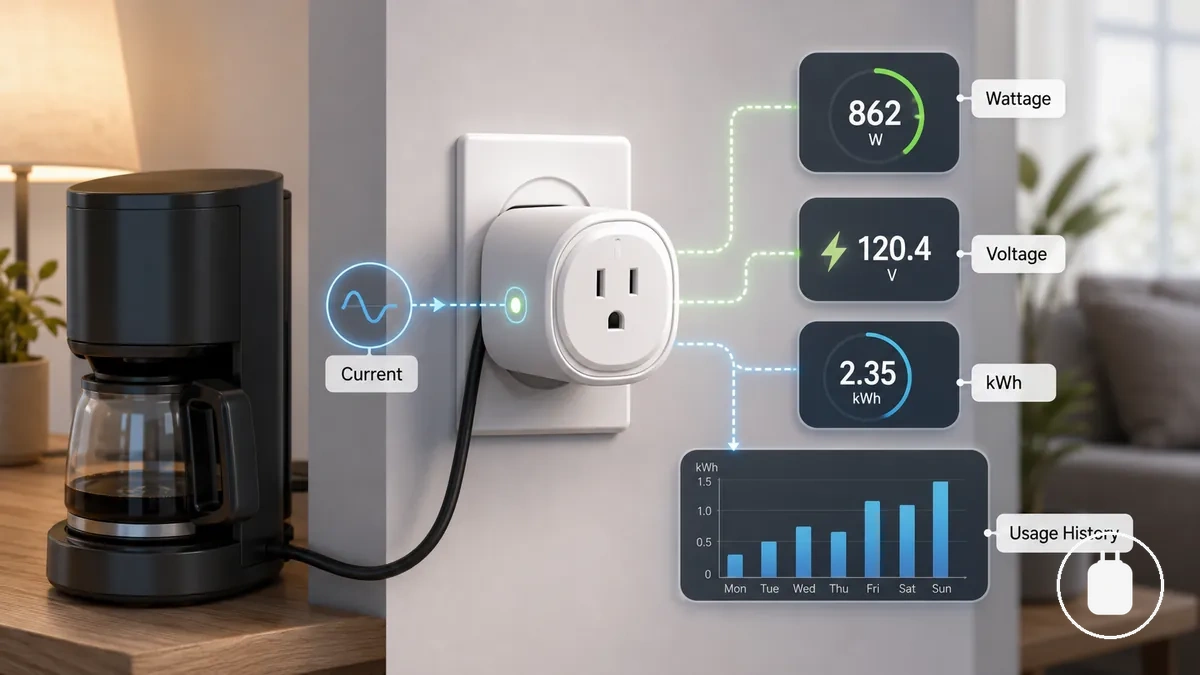
Power measurement connects the smart plug as the entity with electrical readings as attributes and values that provide visibility into plug-level electricity use. Real-time readings show current device behaviour, while kWh tracking and usage history show accumulated consumption over a selected time period. The available readings, refresh frequency, and granularity can vary by model and app support.
Power Measurement Features Inside an Energy Monitoring Smart Plug can be organized by measurement type, unit, and practical meaning. The table below separates common measurement values from what they may indicate and the conditions that can affect interpretation.
| Measurement | Unit or value | What it indicates | Safe limitation |
|---|---|---|---|
| Wattage | W | Shows power usage at a given moment | Reading detail can vary by model and measurement design |
| Current | A | Shows electrical current associated with the connected device | Availability and display options depend on the smart plug |
| Voltage | V | Shows an electrical value associated with the connected load | Displayed values and monitoring depth may differ between models |
| kWh | Energy usage value | Shows accumulated electricity consumption over a time period | Usage history and reporting features depend on app support |
Measurement values can help users understand electricity usage, but they should not be treated as identical across every energy monitoring smart plug. Factors such as model design, app display features, and measurement capabilities can affect interpretation. For more detail about measurement reliability, see accuracy.
Real-Time Wattage, Current, and Voltage Readings
Real-time readings show the current operating behaviour of a connected appliance rather than long-term consumption by themselves. These readings are momentary signals that help users understand active use and short-term monitoring conditions. Wattage, current, and voltage describe different electrical values linked to the appliance state.
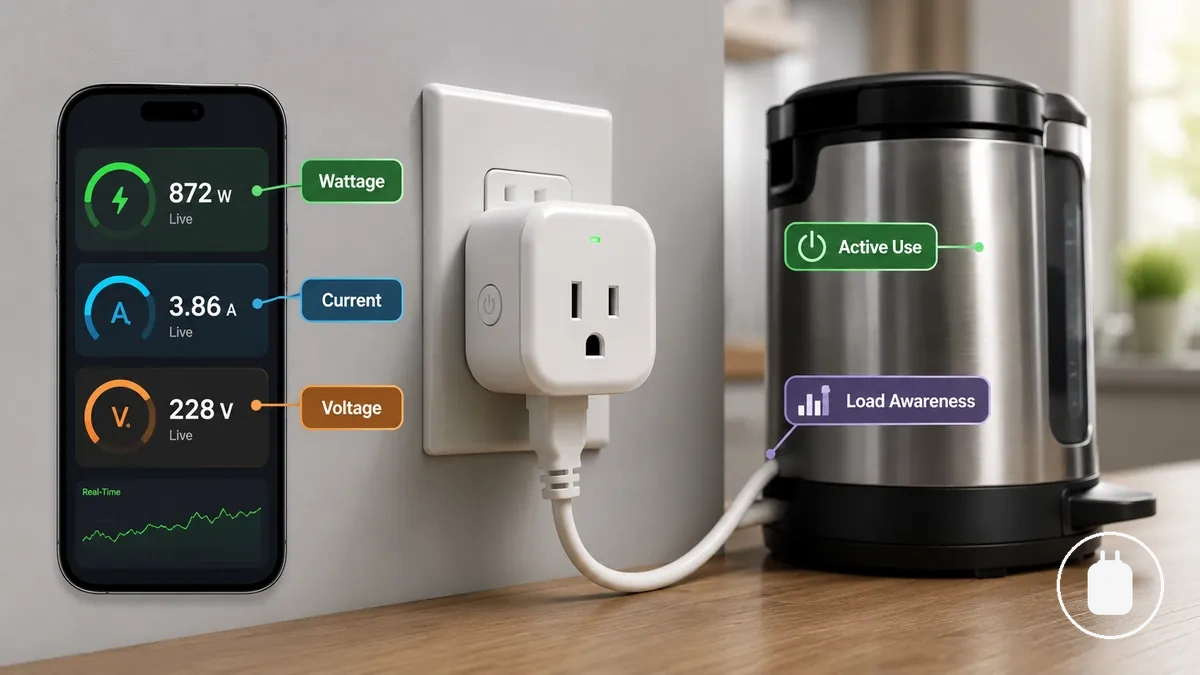
Real-time wattage, current, and voltage readings describe different live conditions from a connected smart plug. Wattage shows the current power usage level, while current and voltage provide additional electrical values when supported by the model. These readings can help with load awareness during active use, but their availability, refresh rate, and display detail can vary by smart plug model.
- Wattage: Shows the power usage level of a connected appliance during a specific moment.
- Current: Shows electrical current associated with the appliance state and load conditions.
- Voltage: Shows an electrical value related to the connected device and monitoring context.
Real-time readings represent short-term monitoring conditions, while usage history and kWh values represent accumulated consumption over time. For example, an appliance may show different live readings during active use compared with standby use. These values provide visibility into current behaviour but do not replace broader usage tracking.
kWh Tracking and Usage History
kWh tracking shows accumulated electricity use over a time period rather than a single moment of appliance activity. Usage history organizes this accumulated consumption into patterns that can help users understand energy behaviour over time. kWh history represents accumulated use recorded across a selected period.
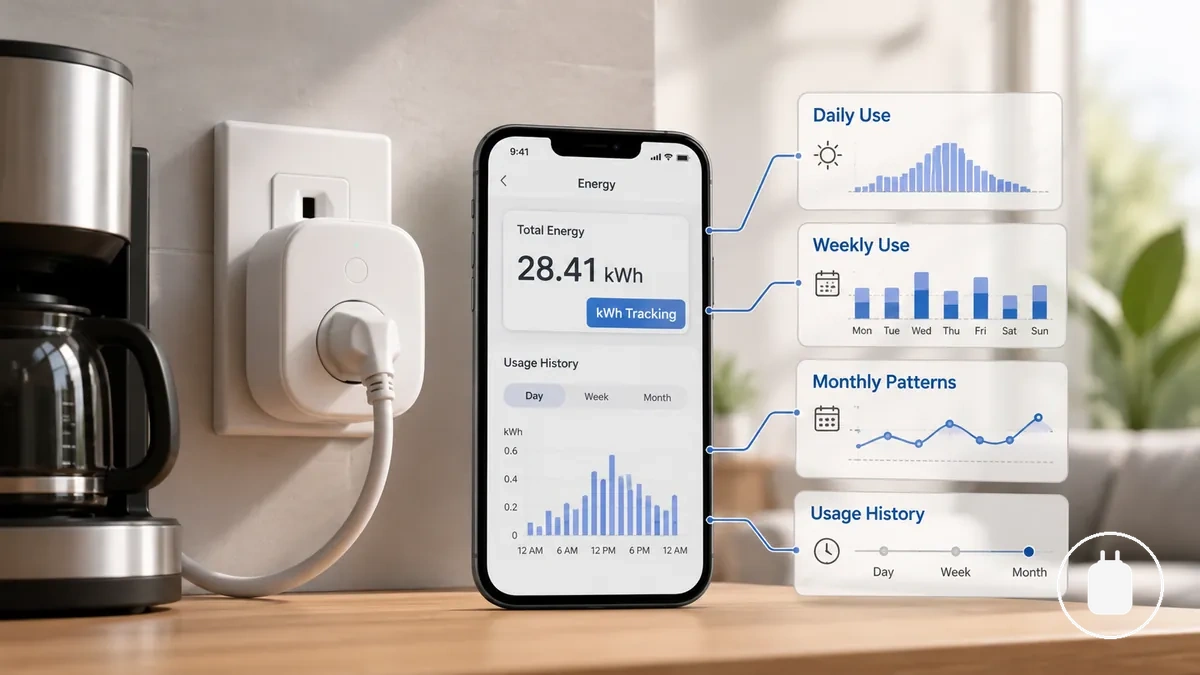
kWh tracking and usage history connect energy values with daily use, weekly use, and monthly patterns. Real-time readings show current appliance behaviour, while accumulated consumption shows how usage changes across longer periods. These patterns can support decisions about appliance routines when the available app report depth provides suitable information.
A simple example can show how accumulated consumption builds over a time period: recorded kWh values from repeated appliance use can be combined to understand a broader usage pattern. The result depends on the available usage data, app summaries, and report depth provided by the model or platform. App history features such as export options and reporting detail can vary.
App Control Features That Connect Readings to Device Control
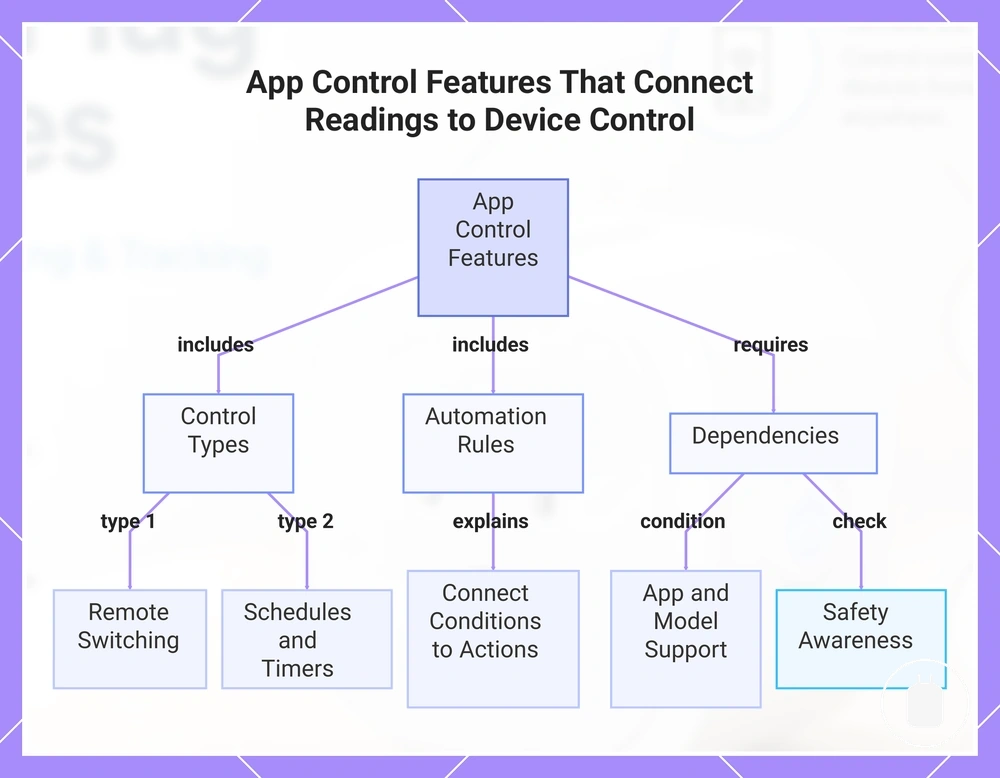
App control features connect monitored readings with practical device control by turning energy information into possible actions. These features help users respond to appliance routines, usage patterns, and device conditions through supported control options. Control features act on monitored conditions rather than replacing the need to understand the connected appliance.
App control can include remote switching, timers, schedules, and automation features that connect device state with everyday routines. Remote switching can provide app-based device control when supported, while timers and schedules can organize repeated appliance routines. Automation rules can connect a condition or monitored reading with a control action when supported by the model and app environment. For example, a predictable standby use pattern may help users decide whether a control feature is useful for a specific appliance routine.
These control features depend on factors such as app support, model capabilities, and safe appliance judgement. Usage information and device interaction can be considered together through app tracking features. Remote or automated control should be evaluated according to the connected appliance and operating conditions.
App Control Features That Connect Readings to Device Control can be checked by control type and use condition:
- Remote switching: Provides control over device state when supported by the app and model.
- Schedule support: Organizes repeated actions around an appliance routine.
- Timer support: Uses time-based control for selected device behaviour.
- Automation conditions: Connects control actions with supported triggers or rules.
- Safety awareness: Requires consideration of appliance suitability and operating conditions.
This chart shows the main types of app control features, their automation rules, and the dependencies that affect their use.
Remote On-Off Control
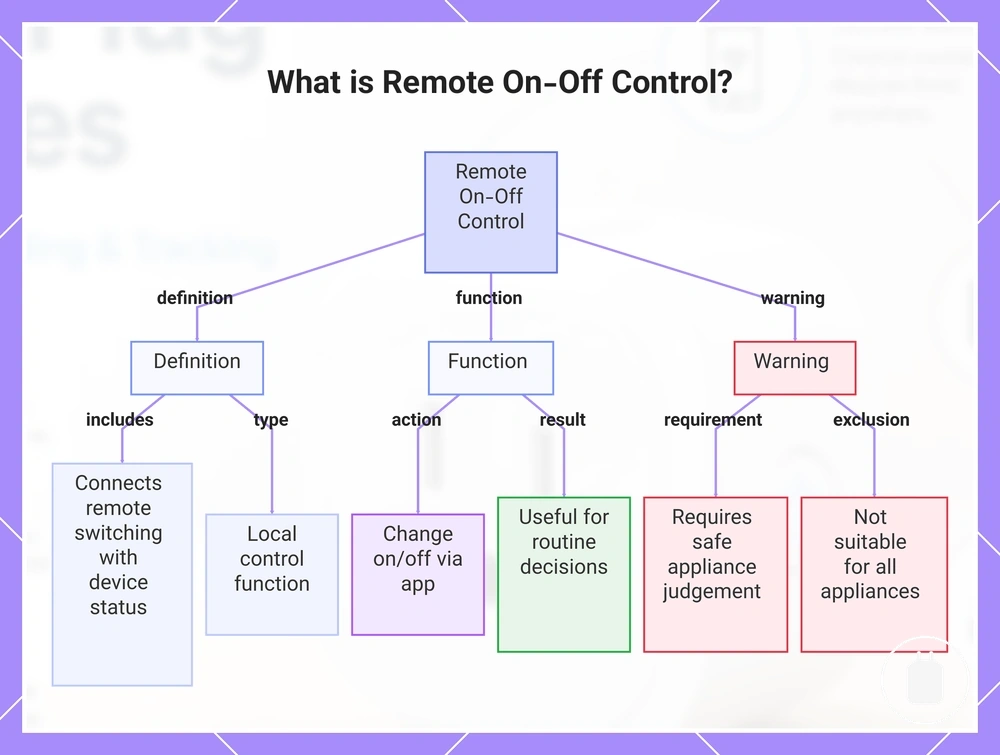
Remote on-off control is a local control function that connects remote switching with the device status of a connected appliance. It allows a user to change the on or off state through app access when supported by the smart plug and its control environment. The function connects device control with awareness of the current appliance state.
For example, remote switching can allow a user to change a connected appliance state without being physically beside the socket. This can be useful when checking device status is part of a routine decision. Remote on-off control should still involve safe appliance judgement because some appliances may not be suitable for remote switching without user awareness.
This chart shows the definition, function, and safety warning of remote on-off control for smart plugs.
Schedules, Timers, and Automation Rules
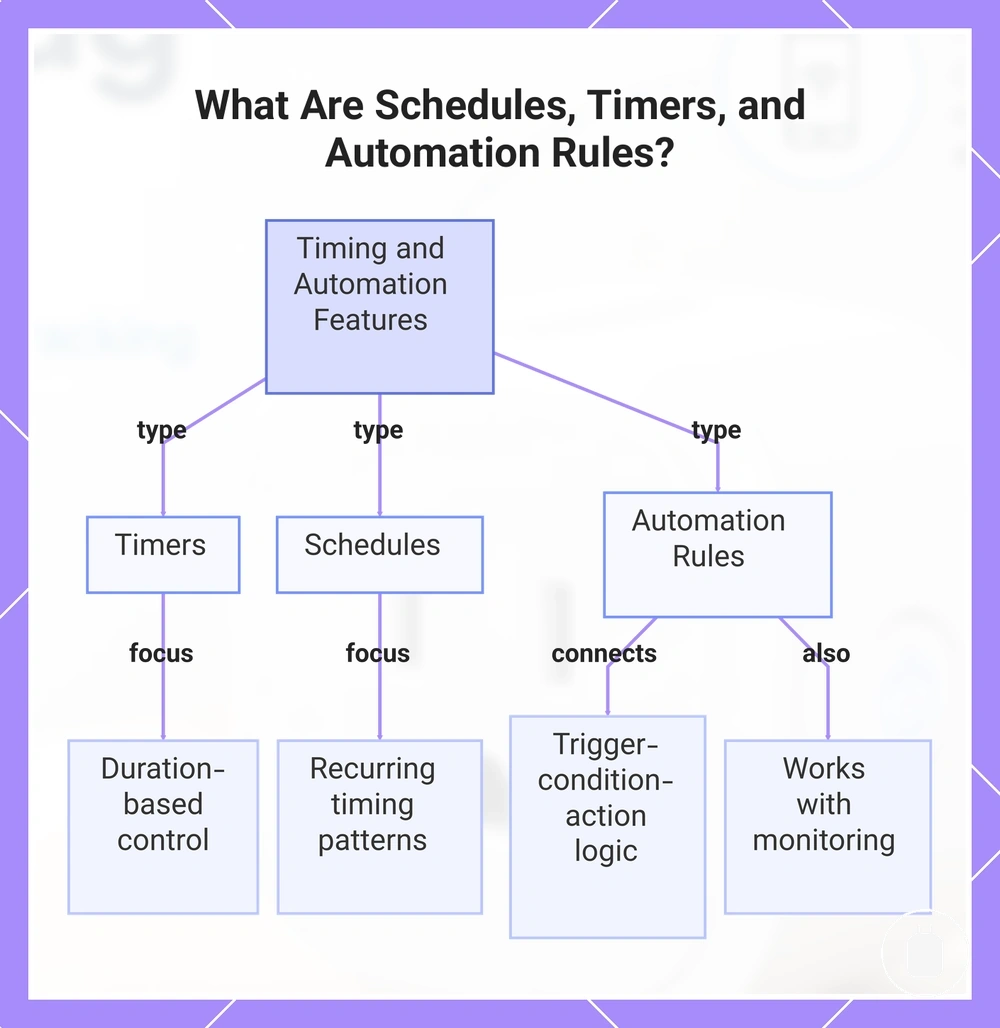
Schedules, timers, and automation rules are control features that manage device behaviour through timing, repetition, or condition-based actions. Timers focus on duration, while schedules focus on recurring timing patterns. This distinction helps separate timer length from schedule recurrence when organizing appliance routines.
Automation rules connect a trigger or condition with a supported control action. These rules can work alongside monitoring by linking observed conditions with possible device responses, but app support and available features can vary. Schedules, timers, and automation rules should be considered according to the connected appliance and the intended use condition.
Schedules, Timers, and Automation Rules can be checked by timing logic, recurrence, and trigger conditions:
- Timers: Use timer length to control a device for a selected duration when supported.
- Schedules: Use schedule recurrence to organize repeated actions around an appliance routine.
- Automation rules: Use an automation trigger or condition to connect a supported event with a control action.
- Device runtime: Helps users understand how timing choices may influence when a device operates.
This chart shows the three main types of device control features and their core attributes.
Energy Data Display Features in the App
Energy Data Display Features in the App are the interpretation layer that makes monitoring data understandable after measurement occurs. App display features organize raw measurement information into views such as dashboards, charts, and summaries that help users interpret usage patterns. These features act as interpretation aids rather than changing the underlying measurement.
App display features can include dashboards, charts, usage summaries, cost estimates, and energy reports that present monitoring data in different ways. The app tracking features behind these views can help organize usage information, while available display depth and report details can vary by app and model. Energy Data Display Features in the App can be organized by what each display type helps users interpret:
| App feature | Data shown | What it helps interpret | Limitation |
|---|---|---|---|
| Dashboard | Overview of monitoring data | Provides a quick view of available usage information | Available details depend on the app and model |
| Charts | Usage patterns over selected periods | Helps identify changes and trends in displayed data | Chart detail depends on available reporting features |
| Usage summaries | Grouped consumption information | Helps interpret usage patterns across time periods | Summary detail may vary by platform |
| Cost estimate | Estimated cost information | Helps provide cost context from displayed usage data | Values depend on inputs and conditions used by the app |
| Energy reports | Reported usage information | Helps review broader consumption patterns | Report depth and format can vary by app support |
App display features help users interpret monitoring information, but a polished display does not prove that the raw measurement has perfect accuracy. Display capability, report detail, and measurement reliability should be considered as separate factors. For broader reporting views, energy reports provide a related area for reviewing available usage information.
Dashboards, Charts, and Usage Summaries
Dashboards, charts, and usage summaries are visual organization features inside the app that help users interpret monitoring data. These display forms arrange information into different views, making usage patterns easier to understand. Dashboards, charts, and summaries provide separate ways to view app data across selected periods.
Dashboards provide an overview of available information, while charts organize values using a chart interval and usage summaries group information across a summary period. These display forms can help identify appliance patterns and support quick interpretation without replacing the underlying raw measurement. A daily view may help clarify short-term changes in an appliance routine, while a monthly view may help show broader usage patterns over a longer period.
Cost Estimates and Energy Report Signals
Cost estimates and energy report signals are interpretive features that translate usage data into practical cost context. They use measured kWh as a basis while adding information such as tariff input and report period to create an estimated cost view. This separates estimated cost from measured kWh as two related but different types of information.
Cost estimates use tariff input and usage data to provide conditional value, while energy report signals organize information across a report period for interpretation. These features can help users understand cost context from recorded usage patterns, but the result depends on settings, assumptions, and available data. Estimated cost provides guidance for interpretation rather than a guaranteed bill match.
Safety Features That Affect Energy Monitoring Reliability
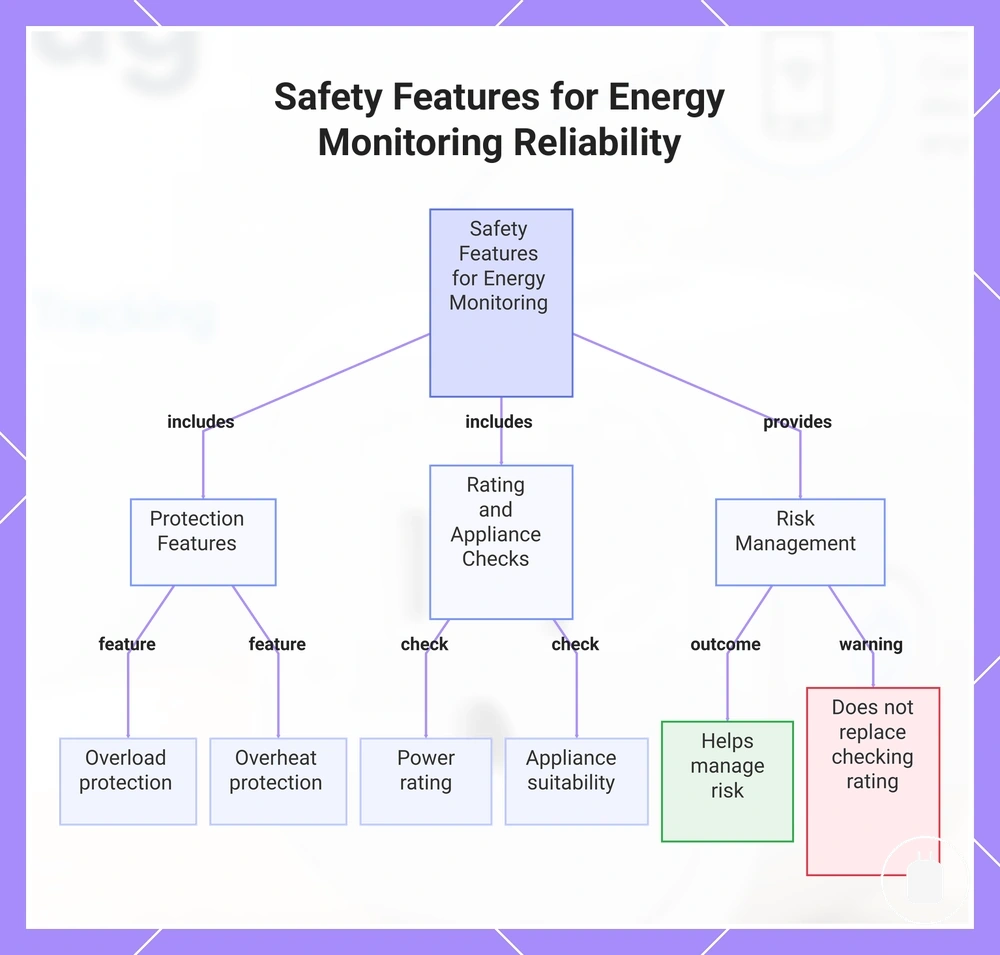
Safety features are risk-control signals that affect how energy monitoring can be used responsibly. These features provide context around monitoring reliability, stable operation, and conditions that may influence connected appliance use. Safety features help frame reliability considerations rather than removing all operating risks.
Safety features can include overload protection, overheat protection, power rating considerations, and appliance suitability checks. These indicators help users consider how a smart plug may respond to appliance load, operating conditions, and continuous use. Stable operation can depend on factors such as model design, local rating, and the connected appliance. Safety Features That Affect Energy Monitoring Reliability can be organized by the following risk conditions:
- Overload protection: Helps manage conditions where appliance load may exceed supported operating limits.
- Overheat protection: Provides a safety indicator related to heat conditions during operation.
- Power rating: Helps compare connected appliance demand with the rated power of the smart plug.
- Appliance suitability: Requires consideration of the connected device and its operating behaviour.
- Continuous use: Requires attention to how long a connected appliance operates under specific conditions.
- Connection stability: Supports consistent monitoring when the model and operating environment allow stable operation.
Safety indicators can help manage risk, but they do not replace checking the smart plug rating and understanding appliance behaviour. The outcome depends on model design, local rating, and appliance load, creating a safe-use boundary for responsible monitoring.
This chart shows the main safety features that affect energy monitoring reliability and their risk management implications.
Overload and Overheat Protection
Overload protection and overheat protection are protective features that relate to connected load and temperature conditions. These features act as risk-control signals that may help manage operating risks when a trigger condition occurs. Their behaviour depends on the protection design and the connected appliance.
Overload protection may respond to conditions involving a connected load that exceeds supported operation, while overheat protection may relate to temperature conditions during use. Some models may provide user notification or shutoff behaviour when a protection condition is detected. These features support safer monitoring decisions but do not replace checking the rated load of the connected appliance.
Overload and Overheat Protection depends on load and trigger conditions:
- Overload protection: Relates to connected load conditions that may exceed supported operating limits.
- Overheat protection: Relates to temperature conditions that may affect stable operation.
- User notification: May indicate a detected condition when supported by the model design.
- Shutoff behaviour: May provide a protective response when supported by the device design.
- Rated load: Requires checking appliance demand against the supported rating before use.
Power Rating and Appliance Suitability Signals
Power rating and appliance suitability signals are specification cues that connect a smart plug with the requirements of a connected device. These signals help users compare plug rating information with appliance conditions before making a suitability decision. Power rating and appliance suitability depend on both the plug specifications and appliance behaviour.
Power Rating and Appliance Suitability Signals can be checked by reviewing key fit conditions:
- Rated current: Shows the current capacity listed for the plug rating.
- Rated wattage: Shows the power capacity information used when comparing connected device requirements.
- Appliance load: Helps consider the demand created by the connected appliance during operation.
- Continuous-use condition: Helps evaluate how ongoing operation may affect suitability.
- Plug rating and appliance behaviour: Both factors contribute to a suitability decision because operating conditions can vary.
Power rating information provides a suitability signal, but it does not establish exact compatibility in every situation. The outcome depends on the plug rating, appliance load, continuous-use condition, and appliance behaviour during use.
Connectivity Features That Keep Monitoring Data Continuous
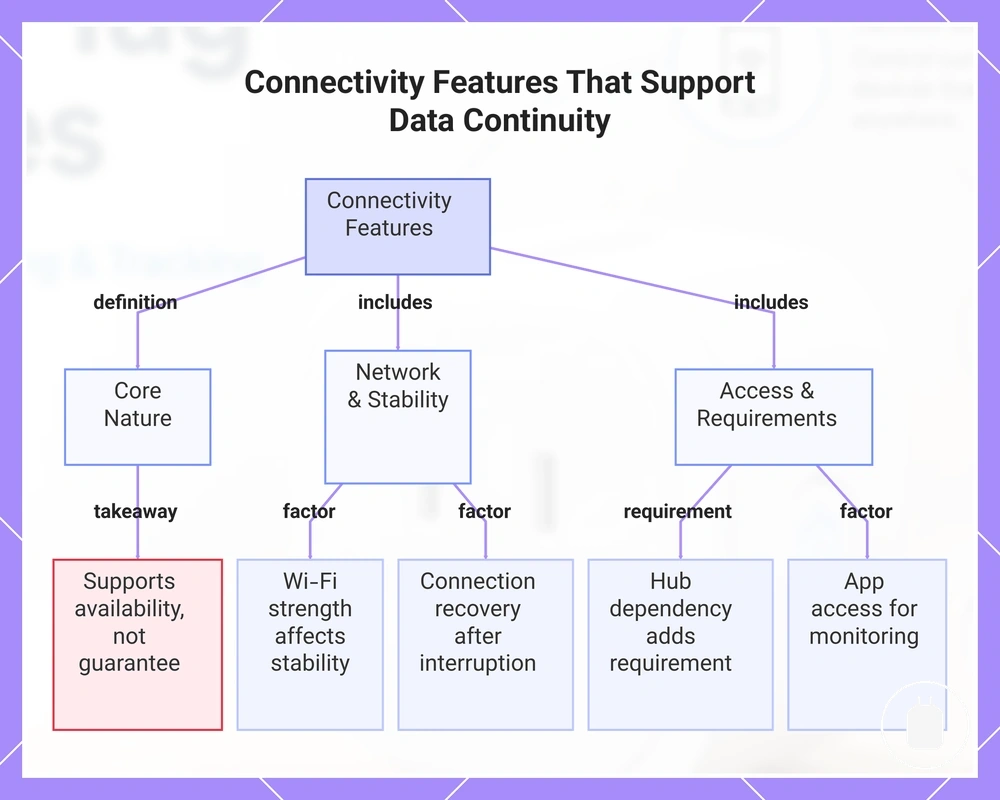
Connectivity features are support conditions that help keep monitoring data, controls, and reports available over time. They influence data continuity by affecting how a smart plug communicates with networks, apps, and supported control environments. Connectivity is a continuity condition that supports availability rather than a guarantee of uninterrupted operation.
Connectivity Features That Keep Monitoring Data Continuous can involve Wi-Fi, hub dependency, app access, connection stability, and cloud control or local control conditions. Wi-Fi and network support can affect connection stability, while hub dependency may add another connection requirement depending on model design. App access, cloud control, and local control can vary by the available app environment and supported features. These conditions help verify the factors that support continuity:
- Wi-Fi strength: Can affect connection stability and the availability of monitoring data when network conditions change.
- Hub dependency: May require an additional connection component depending on the model design.
- App access: Can affect access to readings, controls, and reports through the supported app environment.
- Connection recovery: May influence how data availability changes after a connection interruption.
- Cloud or local dependency: Can affect whether control and data access rely on cloud control, local control, or other supported conditions.
Connectivity behaviour depends on factors such as model variation, network condition, and app environment. A stable connection can support data continuity, but connectivity features do not represent full protocol compatibility or guarantee that every setup will maintain the same readings, controls, or report availability.
This chart shows the key connectivity features that help maintain continuous monitoring data, including their definition, network factors, and access requirements.
How to Judge Which Features Matter for a Specific Use Case
The best feature choice depends on the specific use case rather than the number of available functions. Feature value changes according to appliance type, monitoring goal, safety need, and app expectations. A feature becomes more useful when it matches the conditions and decision outcome required for a particular situation.
How to Judge Which Features Matter for a Specific Use Case can be organized by matching feature groups to practical needs. The appliance type influences which attributes matter, while the monitoring goal determines the information required. Safety need can affect the importance of signals such as power rating, overload protection, and appliance suitability. App expectations can influence the value of dashboards, reports, data continuity, and control features. The following criteria table organizes these use-case factors:
| Use case | Essential feature signal | Optional feature signal | Decision caution |
|---|---|---|---|
| Monitoring appliance usage | Measurement visibility that matches the monitoring goal | Additional usage views or convenience controls | Feature value depends on the information needed for the specific use case |
| Evaluating safety needs | Safety indicators such as power rating and appliance suitability signals | Extra convenience features | Appliance load and operating conditions still influence suitability |
| Managing app expectations | Required access to monitoring data and controls | Advanced display or automation options | App features can vary by model and app environment |
Essential features usually support core measurement, safety, and app needs, while optional convenience features may improve usability without being required for every situation. Separating these groups helps create feature priority based on practical need. The result is a decision-support approach rather than a product ranking method.
Using these criteria helps compare feature value without claiming one option is universally better. A practical buying checklist can help organize the factors that influence a selection decision. The final choice depends on appliance context, required attributes, acceptable conditions, and the intended outcome.
The products below are useful examples for comparing available options. Before buying, check that the compatibility criteria, key features, and product details match your needs.