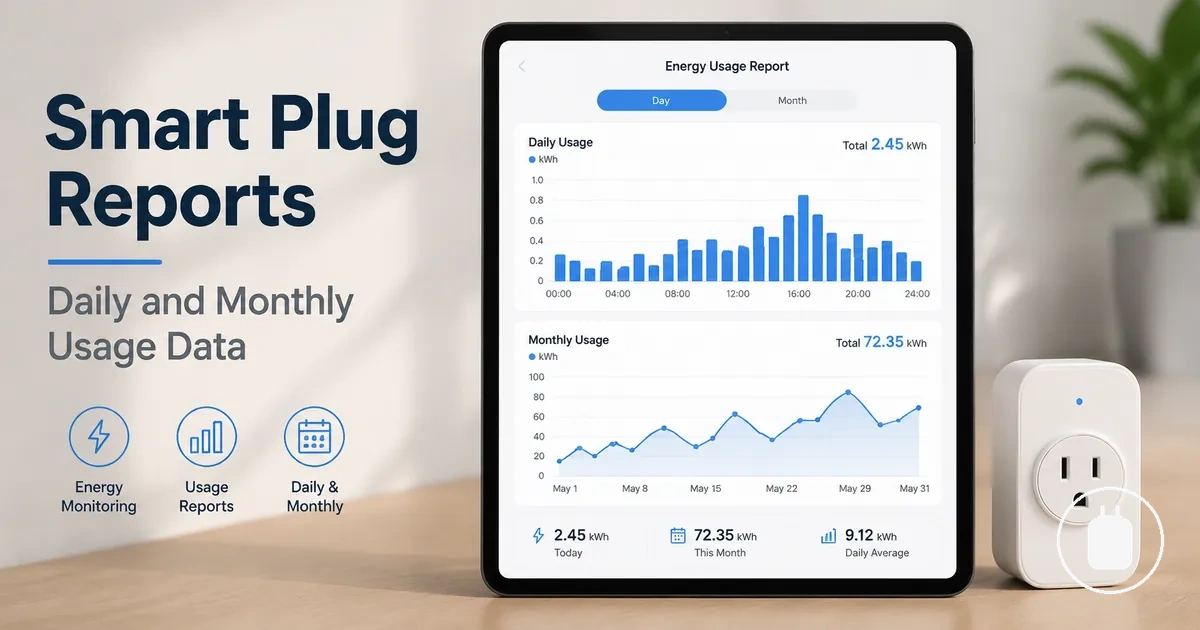
Energy Monitoring Smart Plug Reports and Usage Data
Energy monitoring smart plug reports are app-based summaries of appliance-level electricity usage collected from a connected smart plug. An energy report connects measured electrical values, such as watts and kWh, with a selected time period to help users interpret appliance consumption patterns. The report data focuses on understanding usage behaviour rather than replacing electricity billing information or acting as a product selection tool.
Energy report values become more useful when the measured reading is viewed with its time context. Watts can indicate the rate of power use at a point in time, while kWh represents accumulated consumption across a reporting period. Daily usage, monthly usage, and usage history can help reveal patterns in how a connected appliance consumes electricity.

Energy monitoring smart plug reports can vary depending on the model, app report features, appliance behaviour, connection state, and user configuration. Accuracy, app sync timing, stored data availability, and electricity bill interpretation may depend on these conditions. Plug-level report data can support appliance consumption decisions, while whole-home billing data remains a separate source of electricity information.
Understanding energy report data starts with the relationship between the smart plug, measured electrical values, reporting periods, and usage interpretation. This creates the foundation for evaluating what an app report displays, how consumption patterns develop over time, and how users can apply the information as a practical decision signal.
What Smart Plug Energy Reports Show
A smart plug energy report is a summary of measured appliance electricity use displayed through the plug app or connected platform. The report organizes usage data from a connected appliance into electrical values and a time period, helping users interpret appliance consumption patterns.
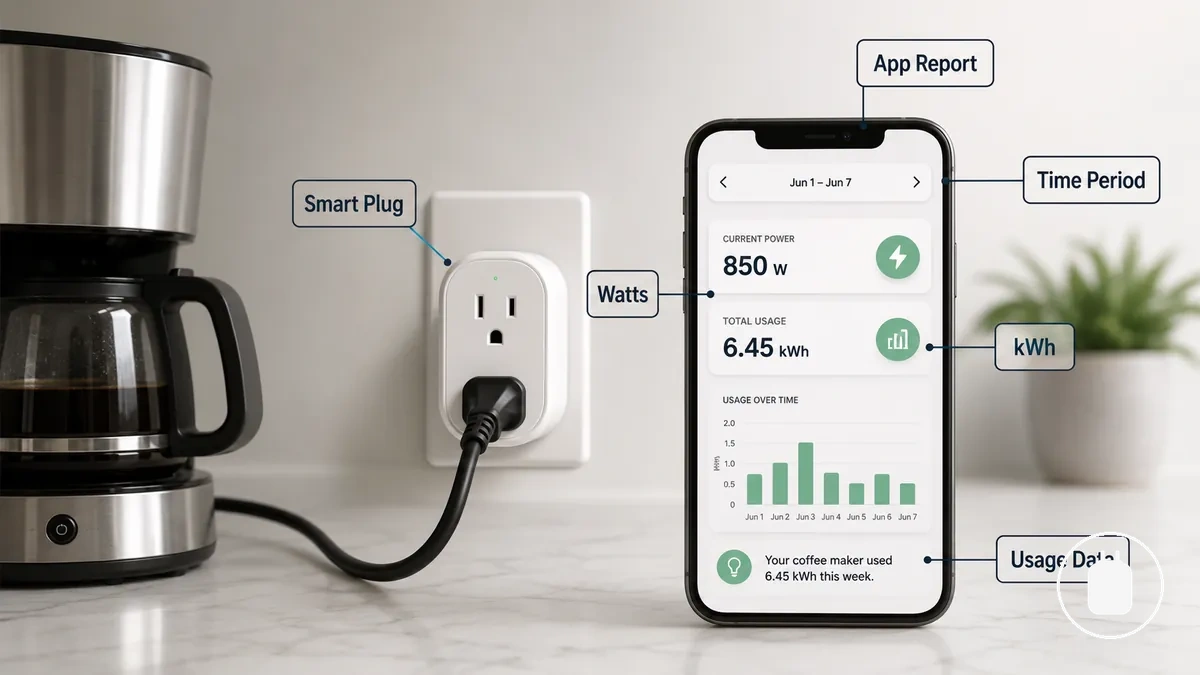
What Smart Plug Energy Reports Show depends on the app and available report fields. Common displayed outputs include:
- Displayed metrics: Values such as watts and kWh that describe reported appliance electricity use.
- Time period: The reporting range used to organize usage data and consumption summaries.
- Connected appliance context: The appliance linked to the smart plug energy report and its plug-level data.
- Usage history: Available stored data that may help identify consumption patterns over time.
- Interpretation: The meaning of reported values when reviewing appliance use and consumption behaviour.
The energy monitoring smart plugs category uses these reports to help users understand plug-level appliance data. A smart plug energy report summarizes connected appliance usage and does not replace whole-home meter information.
Core Measurements in Energy Usage Reports
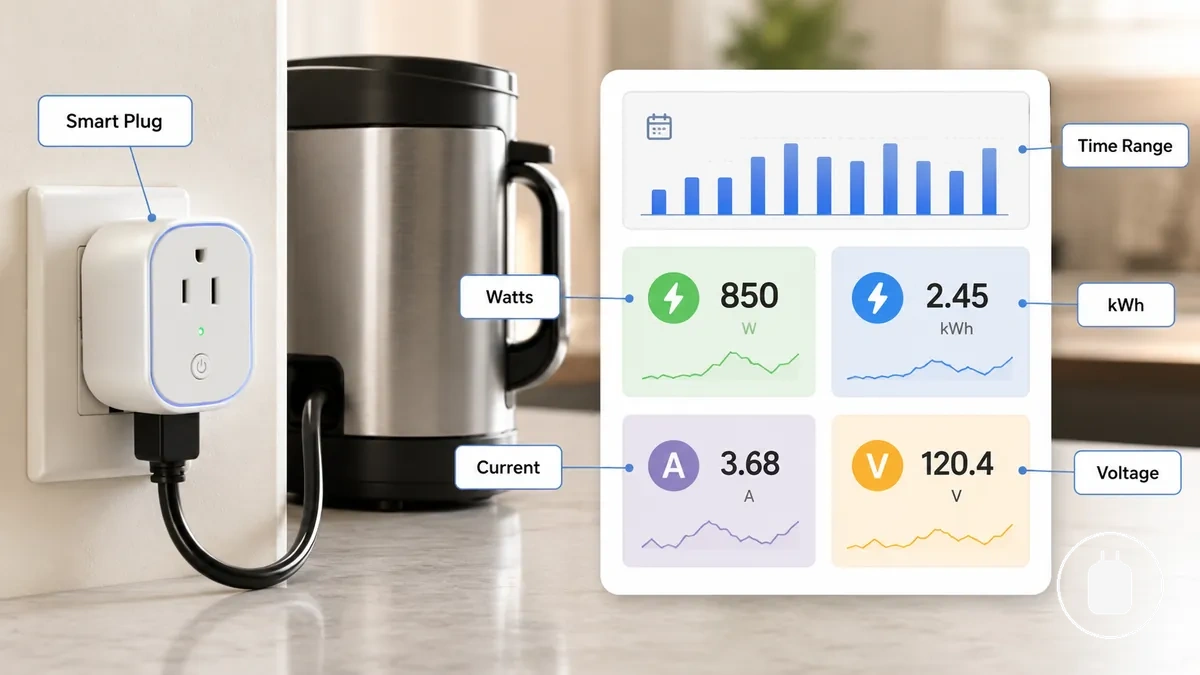
Energy usage report measurements are the recorded values that describe connected appliance electricity use. Each measurement has a unit, a reported value, and a meaning that helps users interpret appliance consumption patterns. The main report fields can include watts, kilowatt-hours, current, voltage, and related electrical values shown through an app.
Different measurements provide different types of usage information. Watts describe the rate of power use at a given point, while kilowatt-hours describe accumulated energy over a time period. Current and voltage may appear as supporting values that add context to a reading rather than replacing the main interpretation of energy use.
Core Measurements in Energy Usage Reports can be organized by the value shown, its unit, and how the reading should be interpreted safely. The table below separates report measurements by their meaning, purpose, and limitation.
| Measurement | Unit | What it shows | How to interpret it safely |
|---|---|---|---|
| Watts | W | Power use rate at a specific point or during a reporting interval | Use it to understand appliance power demand with time context. |
| Kilowatt-hours | kWh | Accumulated energy consumption over a selected time period | Use it to interpret reported energy use across the recorded period. |
| Current | A | Electrical flow value that may support the report reading | Treat it as a supporting value that adds context to other measurements. |
| Voltage | V | Electrical value that may be displayed by supported apps | Use it as supporting information rather than a standalone consumption measure. |
| Related values | Varies | Additional app-supported electrical readings | Interpret each value according to its displayed meaning and context. |
Power usage in watts
Watts measure the rate of power draw from a connected appliance at a specific moment or during a reporting interval. A watt reading shows how much power an appliance is using at that point, which helps interpret the appliance state and usage pattern.
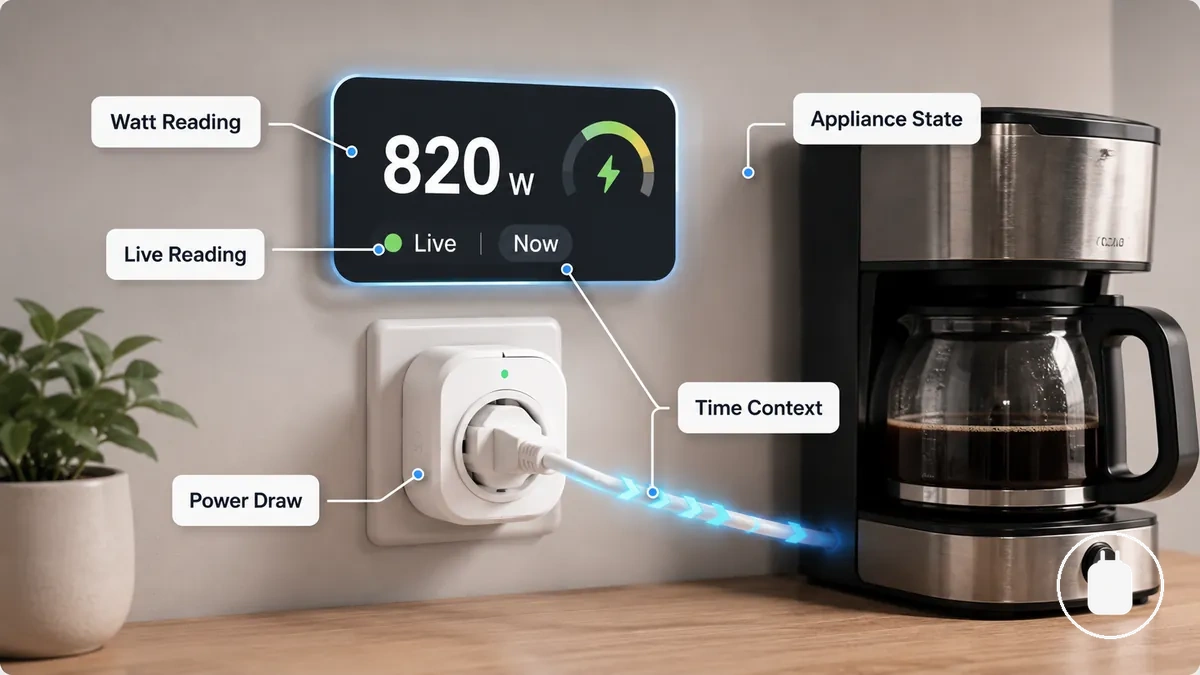
Power usage in watts describes the rate of electricity use, while kWh describes accumulated energy over a period of time. Watts can provide context through a live reading, average wattage, or peak wattage, but the reading needs time context to support broader consumption interpretation.
- Live reading: Shows the power draw at a specific moment.
- Average wattage: Shows the typical power level recorded across an interval.
- Peak wattage: Shows a higher recorded power level during the measured period.
Energy consumption in kilowatt-hours
Kilowatt-hours (kWh) show accumulated energy use from a connected appliance over a selected time period. A kWh reading represents the total consumption recorded during that range, helping users interpret how appliance use builds over time.
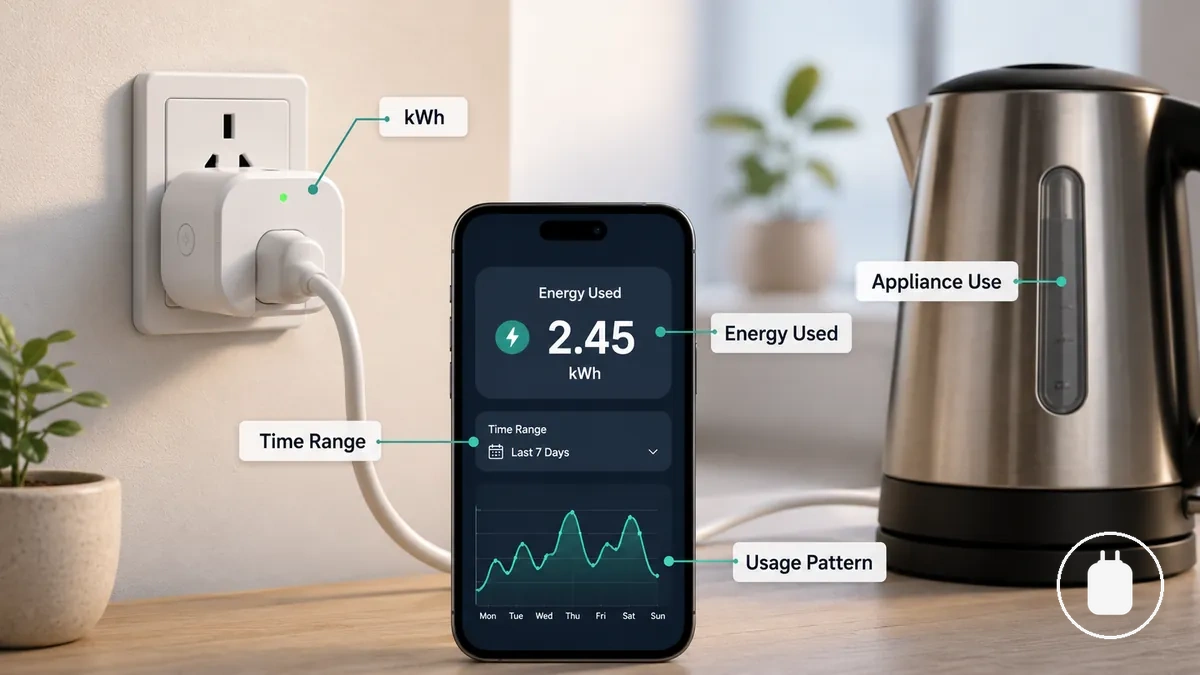
Energy consumption in kilowatt-hours provides a different view from watts because watts measure the rate of power use, while kWh measures accumulated energy. The time range is a key condition because appliance use duration affects the reported consumption total.
Electricity billing interpretation depends on factors such as tariff details, appliance behaviour, and the report context. A simple relationship is: accumulated energy = power use over time. kWh can help connect appliance use with consumption patterns, but any cost estimate requires the relevant billing information.
Current, voltage, and related electrical values
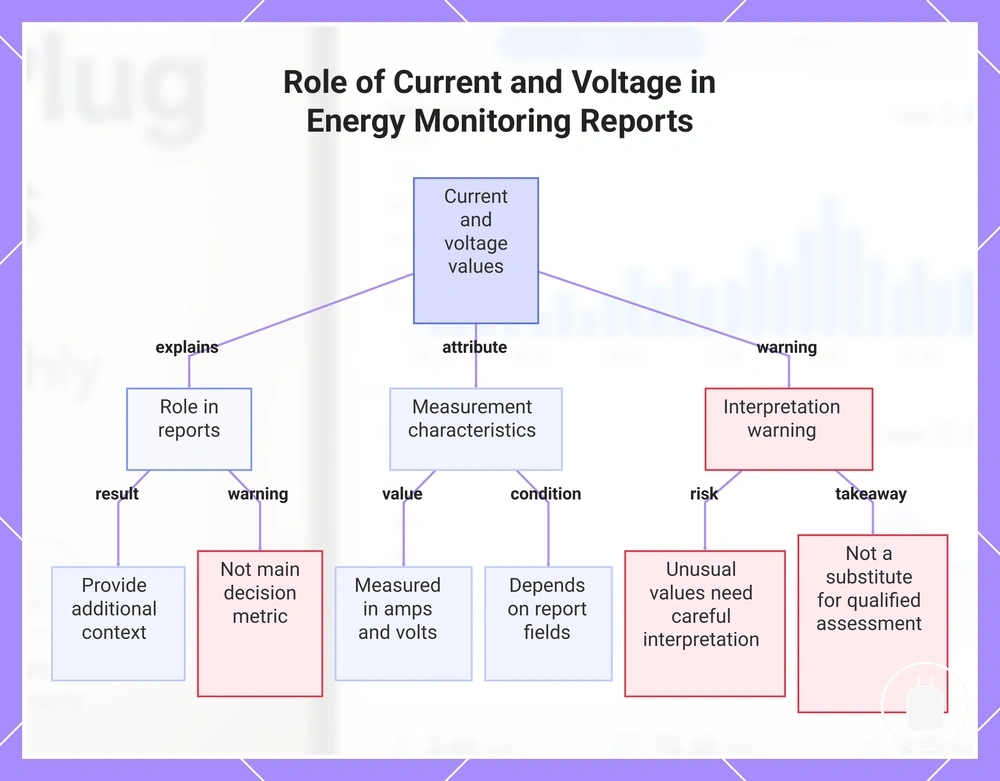
Current, voltage, and related values are supporting measurements that may appear in some energy monitoring app reports. These electrical values provide additional context for interpreting a reading, but they are not the main decision metric for understanding appliance consumption.
Current is measured in amps and voltage is measured in volts, with each unit describing a different electrical value shown in an app display. Whether these supporting measurements appear depends on the available report fields. Unusual values should be interpreted carefully and treated as context rather than a substitute for qualified electrical assessment.
This chart explains how current, voltage, and related electrical values function as supporting measurements in energy monitoring app reports, and how to interpret them.
Daily, Monthly, and Yearly Usage Summaries
Daily usage, monthly usage, and yearly usage summaries show how appliance consumption changes across different report periods. Each time summary answers a different usage question by organizing energy data into short-term patterns, broader trends, or longer-term consumption views.
Time summaries change how appliance consumption is interpreted because the report period determines how usage data is grouped. Daily usage can reveal routine patterns, monthly usage can highlight trends, and yearly usage can provide a broader view of historical patterns when enough data is available. The meaning of each summary depends on appliance behaviour, operating conditions, and the available usage history.
Daily, Monthly, and Yearly Usage Summaries can be compared by report period, purpose, limitation, and the decision signal they provide.
| Report period | Best for | Watch for | Decision signal |
|---|---|---|---|
| Daily usage | Understanding routine short-term appliance patterns | Short periods may not represent longer usage trends | Helps identify regular daily consumption patterns |
| Monthly usage | Comparing broader usage trends over time | Changes in appliance use can affect comparisons | Helps identify changing consumption trends |
| Yearly usage | Reviewing longer-term patterns and seasonal changes | Seasonal behaviour and changing conditions can affect interpretation | Helps provide a broader baseline for usage decisions |
Usage History, Storage, and Data Retention
Usage history, storage, and data retention determine how energy report information remains available for later review and trend analysis. Stored report data depends on the smart plug app, account access, storage method, and available retention options.
Usage history can vary based on the app or platform that manages the stored report data. Account access may affect whether users can view historical data, compare consumption patterns, or access saved reports over time. Visible history inside an app dashboard may differ from downloadable data or export options depending on available features.
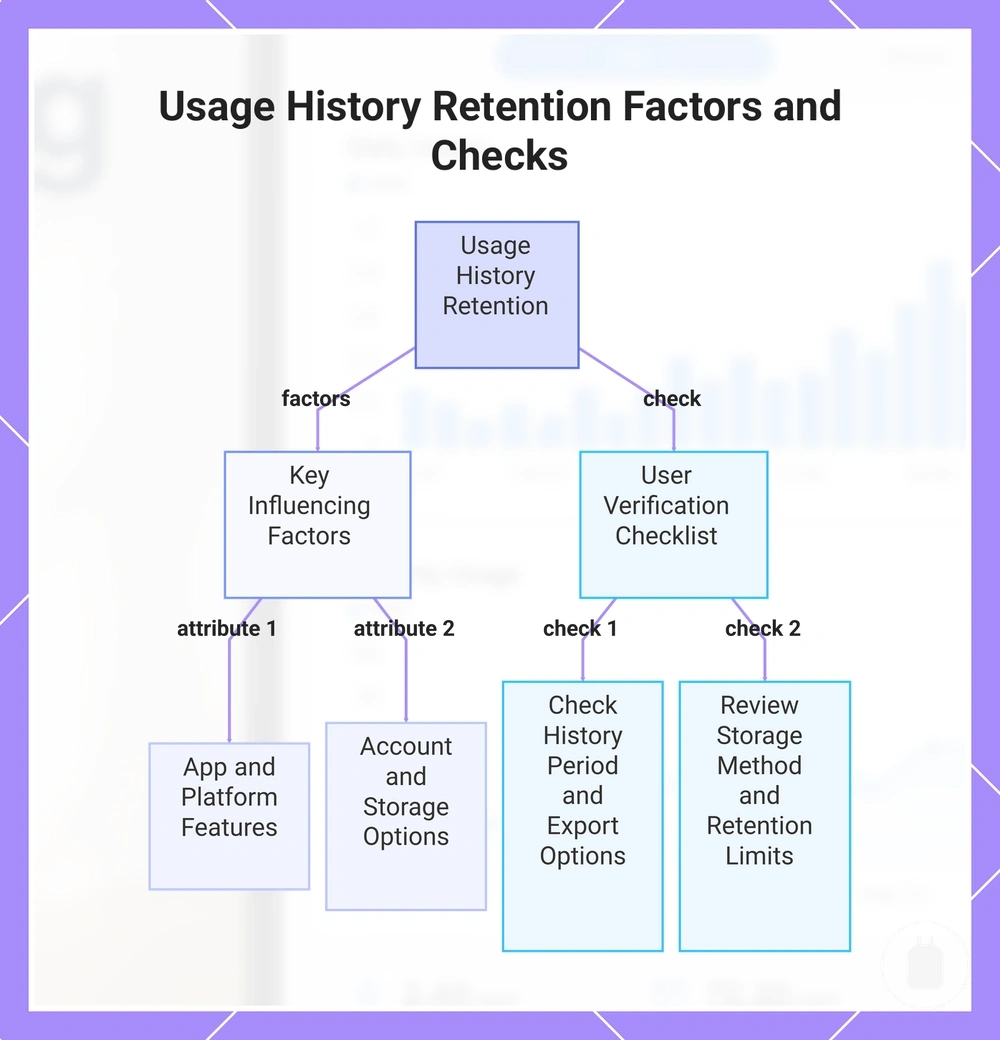
The app data tracking features can influence how usage history and export options are presented. Users can verify the available storage and retention conditions by checking the report history settings and access options.
- History availability: Check the stored report period available for trend analysis and comparison.
- Account requirement: Verify whether an account is needed to access saved usage history.
- Export option: Check whether downloadable data or export features are available.
- Storage method: Review whether reports rely on app-based, cloud, or local storage.
- Retention limitation: Confirm any conditions that may affect access to historical data.
This chart shows the key factors influencing energy report data retention and the verification steps users can take to check availability.
How Report Data Reflects Appliance Consumption
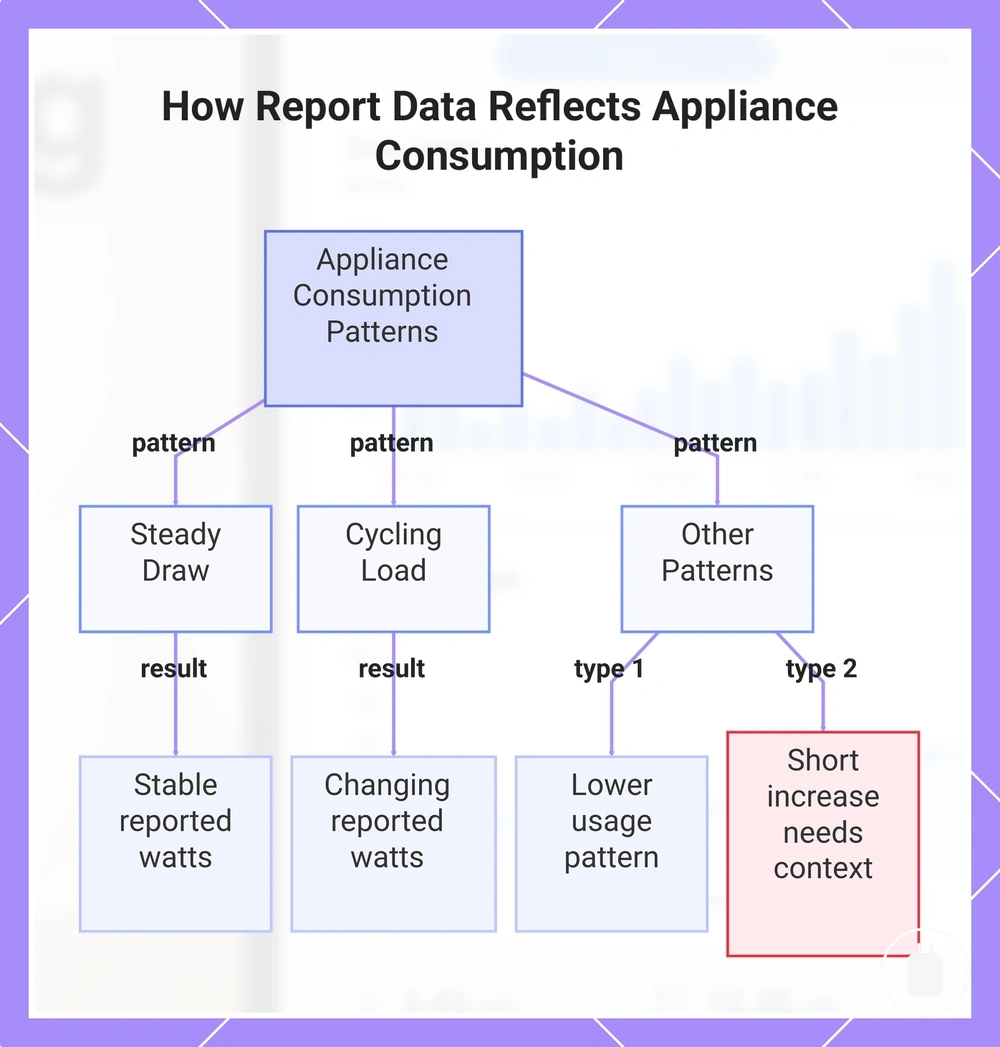
Report data reflects appliance consumption by connecting measured usage patterns with the way a connected appliance operates. An appliance operating pattern can influence reported watts or kWh values, helping users interpret how appliance energy use appears over time.
Different appliance behaviours can create different report patterns. A steady load may produce a more consistent power pattern, while a cycling appliance may show changes as it moves between operating states. A standby load or irregular spike may also appear in the report, but the reason for the pattern depends on the appliance condition and reporting context.
How Report Data Reflects Appliance Consumption becomes clearer when report values are viewed alongside the appliance pattern they represent. The scenarios below show common consumption behaviours and how they may appear in usage reports.
- Steady draw: A consistent operating pattern may create a stable reported watts pattern over a period of use.
- Cycling load: A repeated cycle may create changing reported watts as the appliance changes operating states.
- Standby load: A connected appliance may show a lower usage pattern when it is not actively operating.
- Irregular spikes: A short increase in reported watts or kWh may require additional context before interpreting the cause.
Reading appliance patterns in report data can support a better usage decision when the values are considered with their time range and operating conditions. The reading usage data process can help users interpret reported watts and kWh while keeping conclusions dependent on the available information.
This chart shows the common appliance consumption patterns and how they appear in usage reports.
Report Freshness, Update Frequency, and Missing Data
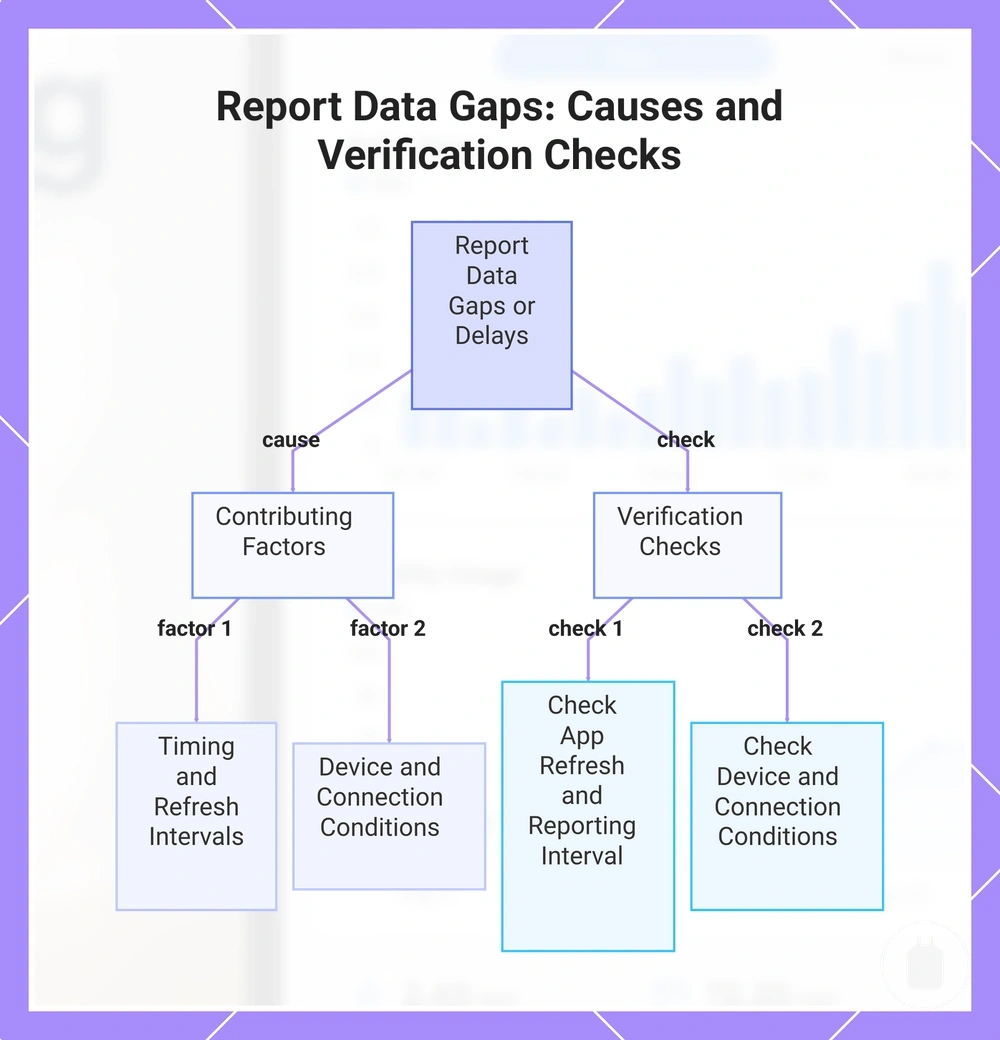
Report freshness affects how complete and current a displayed usage pattern appears. Missing data or delayed updates can affect interpretation because a gap in the report timeline may reflect timing conditions rather than a change in appliance consumption.
Update frequency depends on the reporting interval, app refresh behaviour, sync conditions, and connection state. A report may show delayed data when the app has not refreshed recently, a sync process is delayed, or the device reports less often under certain conditions.
Report Freshness, Update Frequency, and Missing Data checks can help verify the conditions behind a data gap or delay. These checks focus on whether the displayed information is current rather than treating missing data as an incorrect reading.
- App refresh: Check whether the app display has updated with the latest available report data.
- Connection condition: Consider whether connection changes may affect when data becomes available.
- Reporting interval: Review how often the device records and updates usage information.
- Short outage: Consider whether a temporary interruption may create a gap in the report timeline.
- Low-load behaviour: Check whether lower appliance activity may affect how frequently usage data appears.
This chart shows the main factors that can cause gaps or delays in report data and the checks to verify whether missing data is a timing issue rather than a fault.
Limits of Smart Plug Usage Reports
Smart plug usage reports are useful for understanding appliance consumption, but they have limits that affect how the data should be interpreted. Usage report limits can relate to measurement conditions, reporting methods, app features, and the plug-level scope of the collected information.
Accuracy variance, sampling frequency, and app conditions can influence the visible report data. Factors such as reporting intervals, appliance cycling, data gaps, and app retention may affect how complete a usage pattern appears, so readings should be considered within their available context.
The accuracy of readings depends on the measurement conditions and how reported values are interpreted. Smart plug reports describe plug-level appliance data and are different from whole-home meter information, while differences in reported data are not necessarily caused by user error.
| Limit | Likely cause | Visible effect | Safe interpretation |
|---|---|---|---|
| Accuracy variance | Measurement conditions and reporting method | Reported readings may vary depending on usage conditions | Interpret values as reported information with relevant limitations. |
| Sampling frequency | Recording intervals and update timing | Changes in appliance use may not appear immediately | Consider the reporting interval when reviewing patterns. |
| Appliance cycling | Changing operating states during use | Readings may fluctuate during appliance cycles | Consider the operating pattern before drawing conclusions. |
| Data gaps | Missing report periods or delayed data availability | Usage history may appear incomplete | Treat gaps as a limitation of available data rather than a confirmed usage change. |
| App retention and plug-level scope | Available history features and data collection boundaries | Stored reports may have access limits and represent one appliance point | Use reports within their app and plug-level context, not as whole-home meter data. |
Using Energy Reports for Electricity Usage Decisions
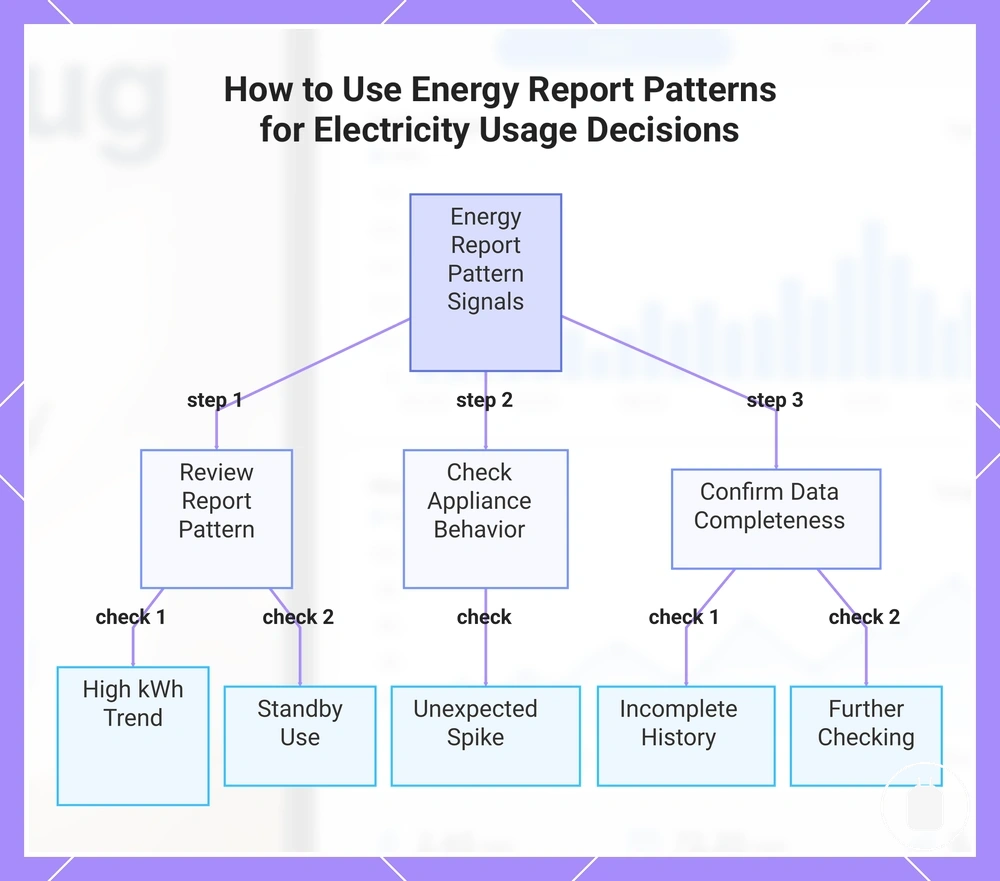
Energy reports can support electricity usage decisions by turning report patterns into decision signals about appliance behaviour. A usage pattern such as a high kWh trend, standby use, unexpected spike, or incomplete history can help identify where further review or monitoring may be useful.
Report patterns can be considered alongside appliance behaviour to understand possible usage implications. A consistently high consumption pattern may indicate a monitoring priority, while standby use or irregular spikes may suggest a need to review how and when an appliance operates. The appropriate action depends on the available report data and the surrounding conditions.
The connection between report trends and electricity bill impact depends on factors such as tariff conditions, appliance use, and how consumption data is interpreted. Energy reports can support cost-awareness, but they do not provide guaranteed savings or exact cost outcomes without the relevant billing context.
Using Energy Reports for Electricity Usage Decisions works best when each pattern is treated as a signal for further evaluation. Reviewing the report pattern, checking the appliance behaviour behind it, and confirming whether the available data is complete can help determine the next suitable step.
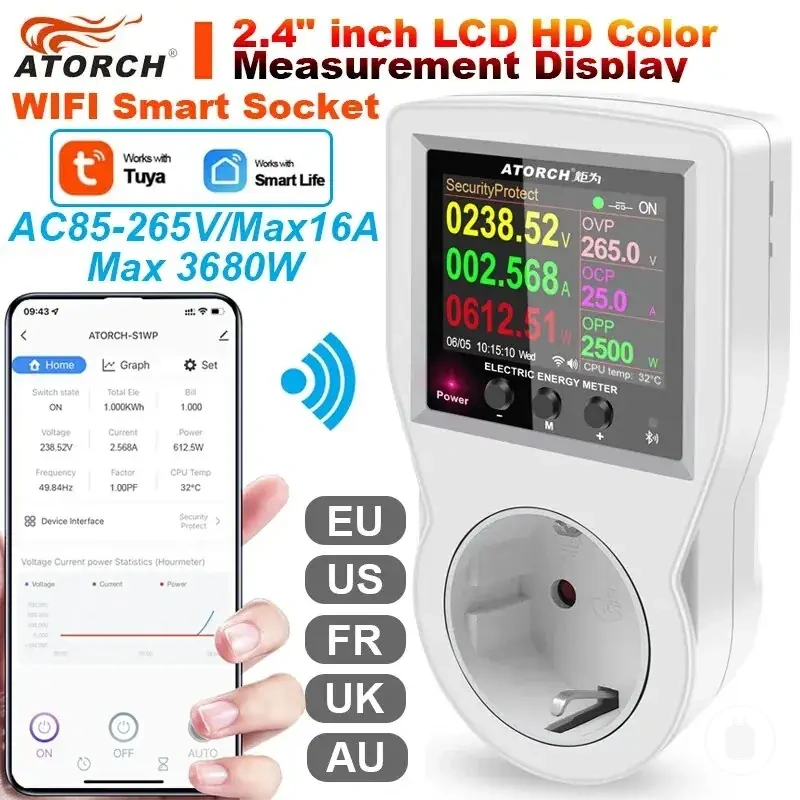
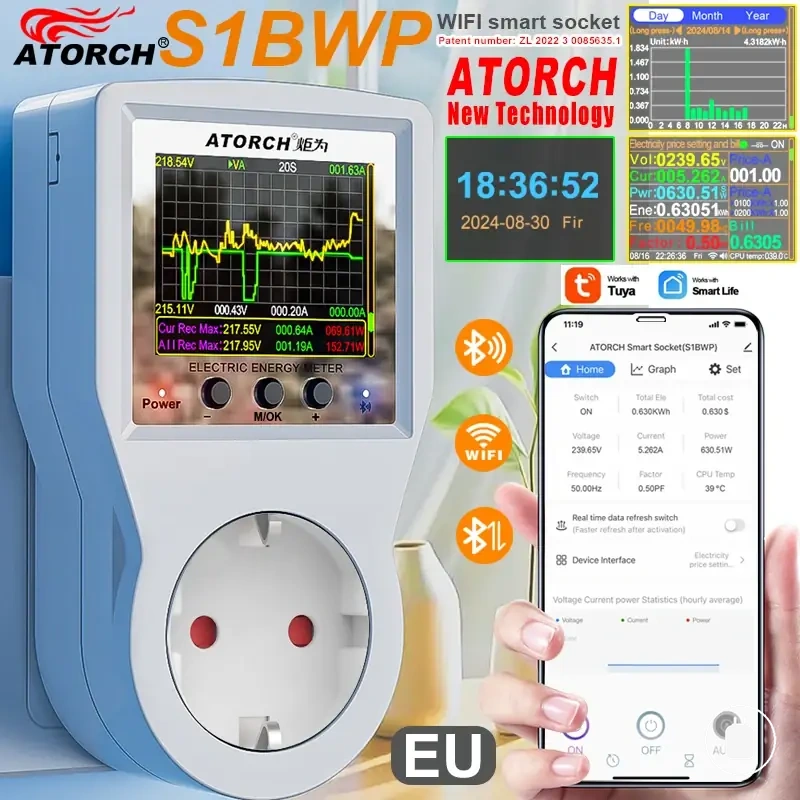
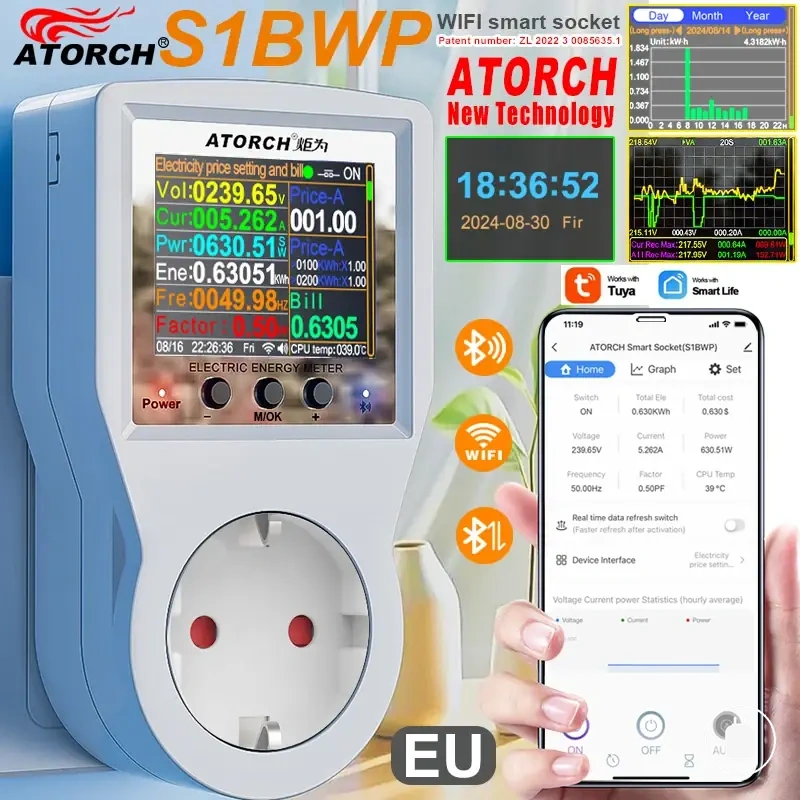
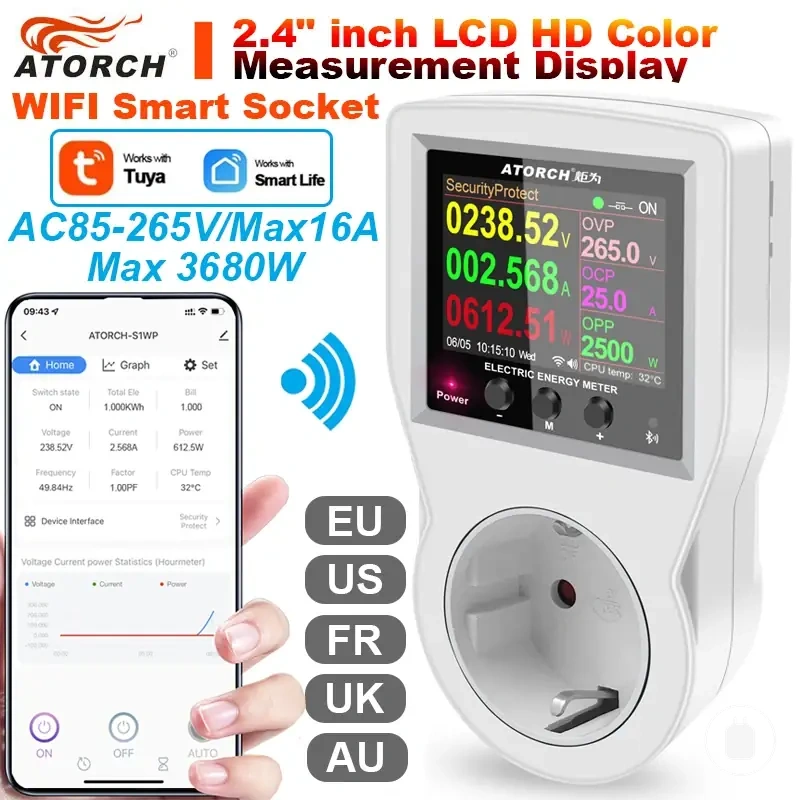
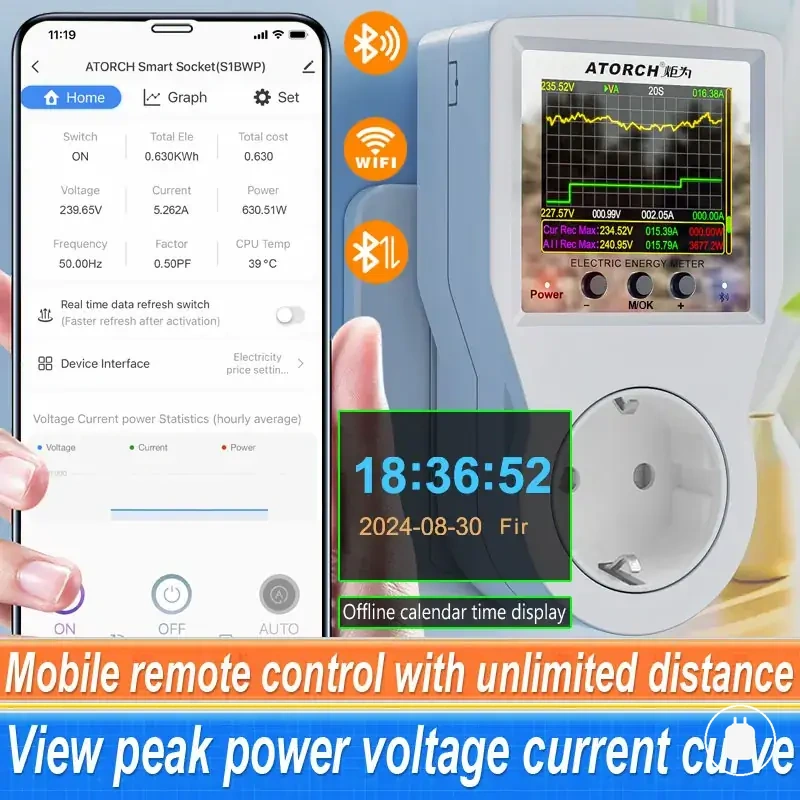
Here are product examples that may make comparison easier. Before buying, always review the compatibility criteria, essential features, and product details.
The following checks can help organize usage decisions:
- High kWh trend: Review whether consistently higher consumption matches the expected appliance usage pattern.
- Standby use: Check whether background consumption is relevant to the monitoring priority.
- Unexpected spike: Consider whether an operating condition or cycle may explain the change.
- Incomplete history: Verify whether missing information affects the confidence of the interpretation.
- Further checking: Determine whether additional context is needed before making a usage decision.
This chart shows how to use energy report patterns as signals for electricity usage decisions, with three main steps: reviewing the pattern, checking appliance behavior, and confirming data completeness.