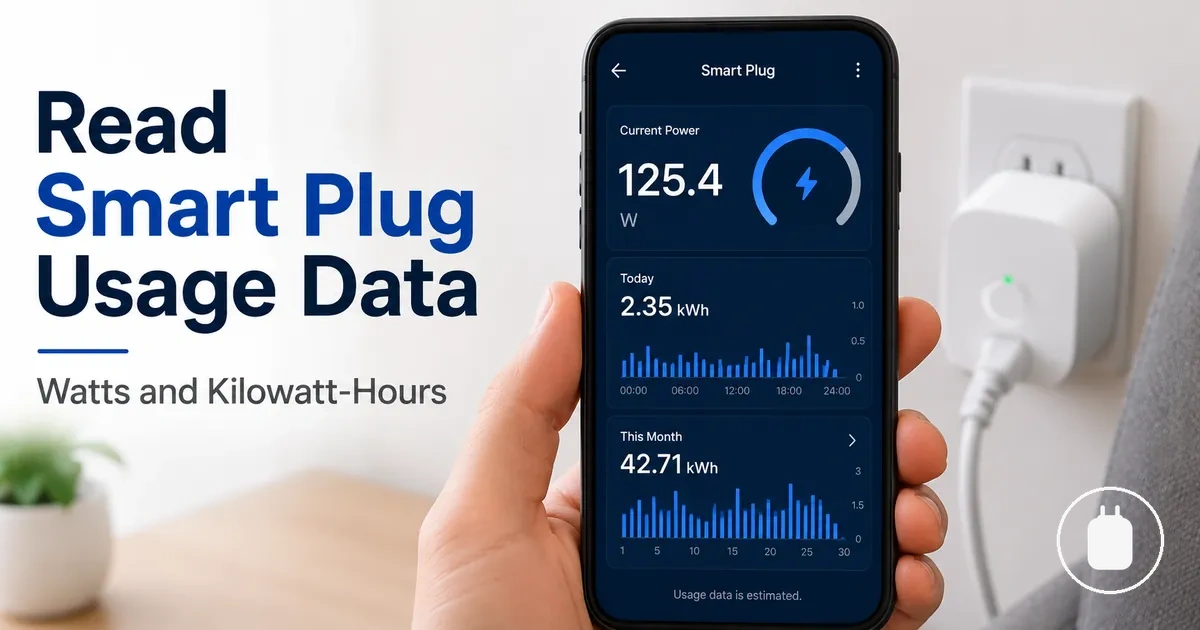
Reading Energy Monitoring Smart Plug Usage Data
Energy monitoring smart plug usage data shows how a connected appliance uses electricity by interpreting readings such as wattage, kWh, and time-based usage context. Reading this data means understanding the relationship between the smart plug, the appliance, live power readings, and accumulated energy over a selected time period.
Energy monitoring smart plug usage data focuses on plug-level electricity interpretation by connecting an appliance’s behaviour with the values displayed in an app. energy monitoring smart plugs provide the measurement point that allows usage information to be observed at the connected appliance level. This reading approach does not replace whole-home measurement or determine an exact electricity bill outcome.
Reading usage data starts by identifying the value shown for the appliance, then separating different types of information. Live wattage represents current power use, while kWh represents accumulated energy over a selected period. The time period and appliance usage pattern provide the context needed to interpret the reading correctly.
Usage readings may vary depending on how an app displays information, how values refresh, and how the connected appliance operates. Accuracy limits, full energy reports, and troubleshooting guidance are separate areas that may support interpretation when a reading needs further checking.
What Smart Plug Usage Data Means
Smart plug usage data is the information shown by an app about power draw and energy use from a connected appliance. These readings help explain how electricity is being used by showing values such as watts, kWh, time period, and usage history.
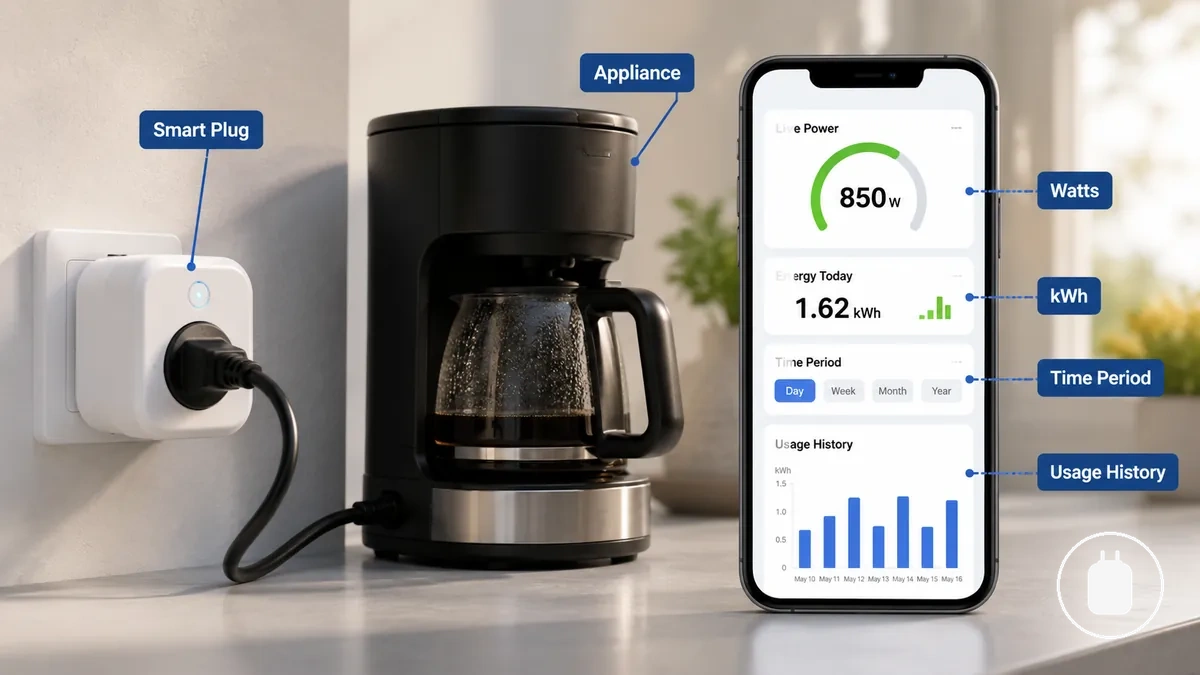
Smart plug usage data connects the connected appliance and its operating state with the values displayed in an app dashboard. Watts can represent current power draw, while kWh can represent accumulated energy over a selected period. The meaning of each usage label may vary by app design, so labels and display formats can differ while describing similar types of energy data.
Common usage labels organise different parts of the reading process. The table below shows how common app labels are usually interpreted and what each value can help identify.
| Data label | What it usually represents | How to read it |
|---|---|---|
| Watts | Current power draw from the connected appliance | Use it to understand the appliance's present power reading |
| kWh | Total energy accumulated over a selected period | Use it to understand energy use across the displayed time period |
| Today, this month, or history | Usage period or recorded usage history | Use it to understand when the displayed energy data was collected |
Broader data tracking can include additional app views and historical information, but interpreting smart plug usage data starts with understanding the labels shown. These readings describe plug-level monitoring and should not be treated as an exact bill calculation or an official electricity reading.
How to Read Real-Time Power Use
Real-time power use shows the appliance’s current or near-current power draw when the app refreshes the reading. The smart plug displays this live wattage value to help interpret the connected appliance’s electricity use at that moment.
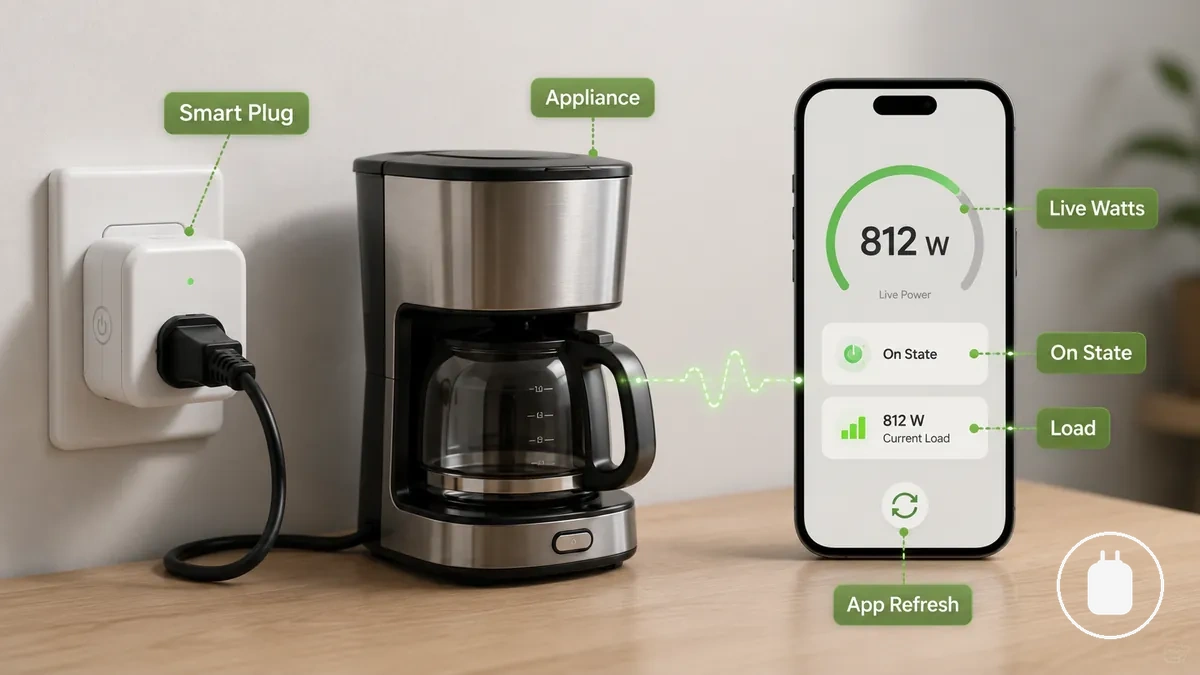
Reading real-time power use requires checking the wattage value together with the appliance state. The appliance’s on/off state and load condition can change the displayed reading, while app refresh timing affects which moment of power draw is shown. Real-time watts describe live power use and are not the same as accumulated energy measured over a longer period.
To read real-time power use, check the live reading while observing how the appliance behaves:
- Check the watts value shown for the connected appliance.
- Observe whether the appliance is on, off, idle, or actively operating.
- Notice how the reading changes when the appliance state or load changes.
- Consider app refresh timing when interpreting the displayed value.
A cycling appliance or a temporary load change may cause the reading to move during operation. The meaning of a change depends on the appliance state, the duration of the change, and the context in which the reading appears.
Watts, Load Changes, and Standby Draw
Watts, load changes, and standby draw show how an appliance’s power reading can change with its operating state. The watt value represents the current power draw shown by the smart plug, while standby draw describes lower power use when an appliance is idle or not actively running.
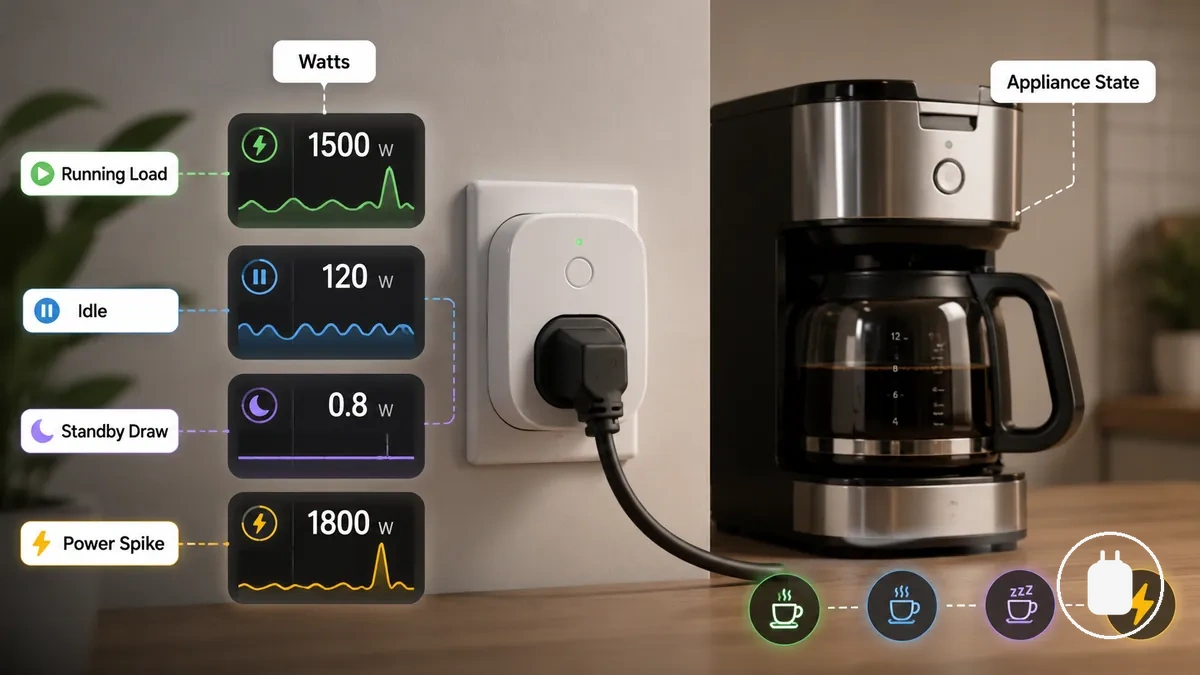
Wattage changes reflect appliance state rather than a fixed appliance identity. A running load, idle state, or short increase in power draw can create different live readings depending on what the appliance is doing at that moment.
- Running load: The watt value may rise when the appliance is actively operating.
- Idle load: The watt value may fall when the appliance is paused or waiting.
- Standby draw: The reading may show lower power use when the appliance remains connected but is not actively performing its main function.
- Usage spike: A brief increase may appear during startup or a mode change and should be interpreted with the appliance state in mind.
A changing watt reading does not automatically indicate a problem. If a value appears unusual, the interpretation depends on the appliance behaviour, duration of the change, and the conditions during the reading.
How to Read Kilowatt-Hour Energy Totals
A kWh total shows accumulated energy used by a connected appliance over a selected period rather than the appliance’s current power draw. The smart plug records an energy total over time, while wattage represents the live power level at a specific moment.
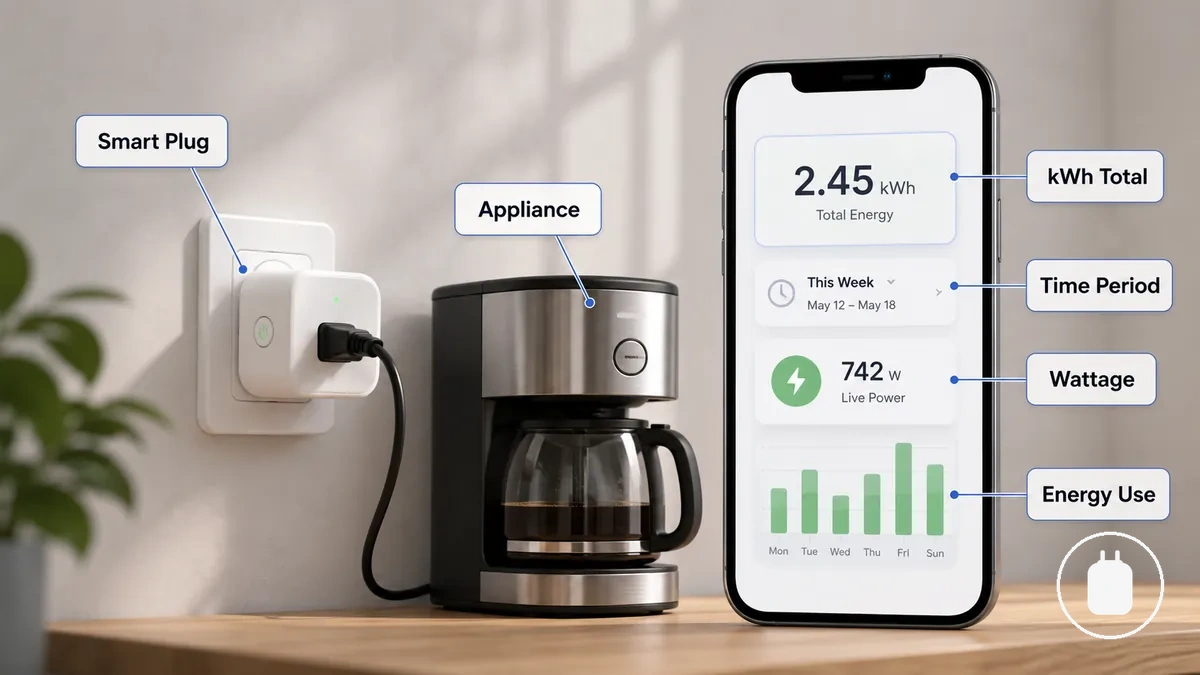
Reading a kWh total requires looking at the selected period, running duration, and appliance behaviour that created the accumulated energy. A longer running duration can contribute to a larger energy total, while the time range determines which usage period the kWh total represents. Watts and kWh describe different parts of energy use: watts show current power draw, while kWh shows accumulated energy over time.
A simple example can help connect wattage, time, and energy. If an appliance uses power while it operates for a period of time, the smart plug can represent that combined usage as a kWh total. This is an illustrative relationship between power and time, not a prediction of an exact cost or bill result.
The meaning of a kWh total depends on the selected period, appliance behaviour, and how the energy information is displayed. Any cost interpretation may also depend on factors such as tariff and usage conditions.
Wh, kWh, and Power Over Time
Wh and kWh are energy units that describe accumulated energy across different scales over time. Wh represents a smaller unit scale, while kWh represents a larger scale of the same type of accumulated energy measurement.
Power over time connects the unit, scale, and time basis of an energy reading. A Wh or kWh value represents accumulated energy collected during a period of use rather than a single live power moment. The interpretation depends on how the unit relates to the amount of energy recorded over that time basis.
| Unit | Scale | How to read it |
|---|---|---|
| Wh | Smaller energy unit | Use it to understand accumulated energy at a smaller scale |
| kWh | Larger energy unit | Use it to understand accumulated energy across a broader usage total |
How to Read Daily, Weekly, and Monthly Usage
Daily usage, weekly usage, and monthly usage show accumulated appliance energy across different time periods. These time-based usage views help interpret how a kWh total changes depending on whether the app displays a short period, a repeated routine, or a broader history window.
Time-based usage views depend on how an app defines each period and when the usage data resets. Daily usage can help review shorter appliance behaviour, weekly usage can provide context for repeated routines, and monthly usage can show broader patterns. The selected period, appliance cycle, and reset timing should be considered before interpreting any trend direction.
The same usage total can provide different context depending on the time range being viewed. The table below organises common time windows and the interpretation risks that may appear when comparing periods.
| Time view | Best use | Interpretation risk |
|---|---|---|
| Daily usage | Review short-term appliance behaviour | Short periods may reflect temporary usage changes |
| Weekly usage | Compare repeated routines over a broader period | Changes may depend on appliance use frequency |
| Monthly usage | Review broader usage patterns | Longer periods may combine different usage conditions |
Longer time periods can support broader trend interpretation, while dedicated energy reports may provide additional history context. App labels, reset timing, and report formats can vary, so usage periods should be interpreted according to the information displayed.
How to Track Appliance Energy Patterns
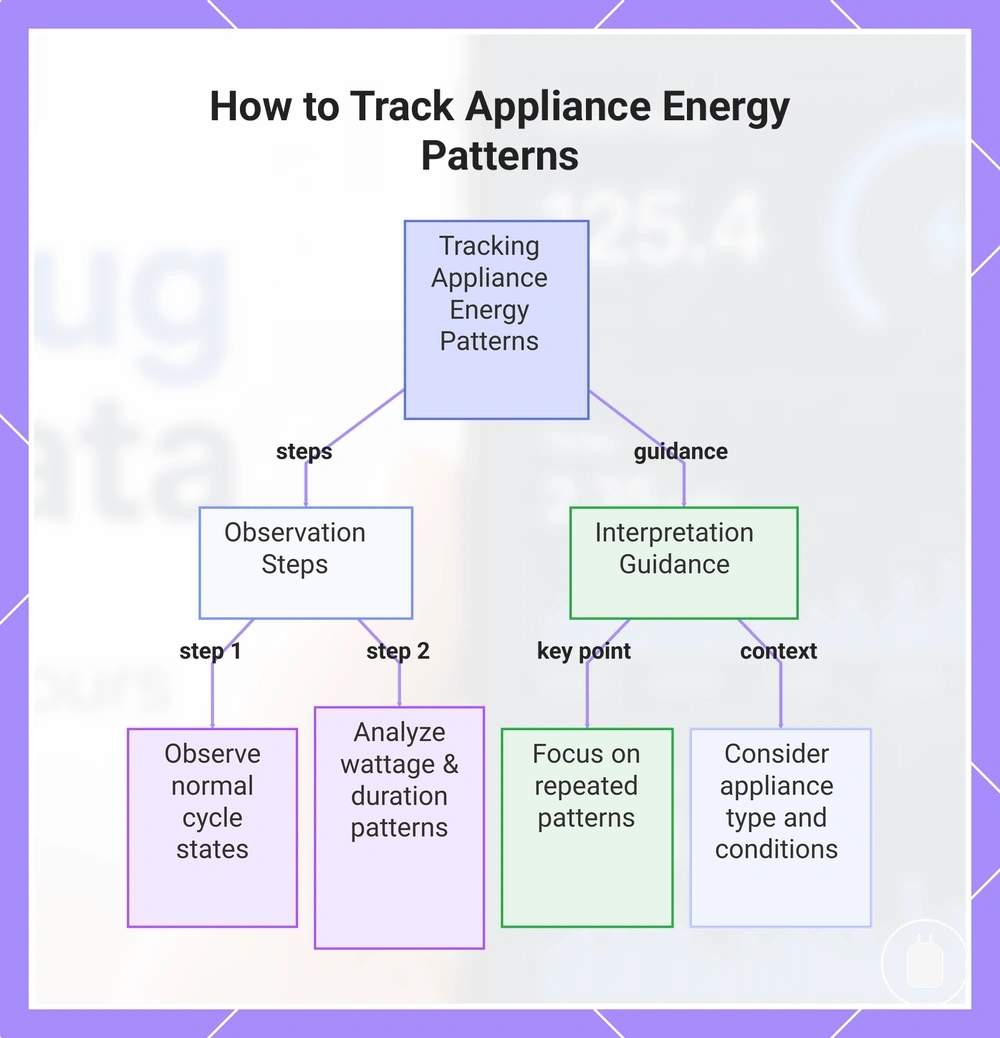
Tracking appliance energy patterns helps connect smart plug readings with repeated appliance behaviour instead of treating each value in isolation. A single reading shows one moment of use, while repeated observation can show how the operating state, duration, wattage change, and kWh accumulation relate to repeated appliance behaviour.
- Observe the appliance during a normal use cycle and note the operating state shown by the smart plug reading.
- Compare wattage changes as the appliance moves between different states, including active operation, idle periods, or changing load conditions.
- Review the duration of each state and how the usage pattern contributes to kWh accumulation over time.
- Look for repeated patterns across similar uses instead of drawing conclusions from one isolated reading.
After the basic observation method is clear, appliance energy use can provide additional context when connecting smart plug readings with how a connected appliance operates.
Cycling appliances, heating devices, standby conditions, and intermittent loads can create different reading patterns. The interpretation depends on the appliance behaviour, operating state, duration, and conditions during the observed usage pattern.
This chart shows the main steps to observe and interpret appliance energy patterns using smart plug readings, focusing on repeated behavior over isolated values.
Running Loads, Idle Loads, and Usage Spikes
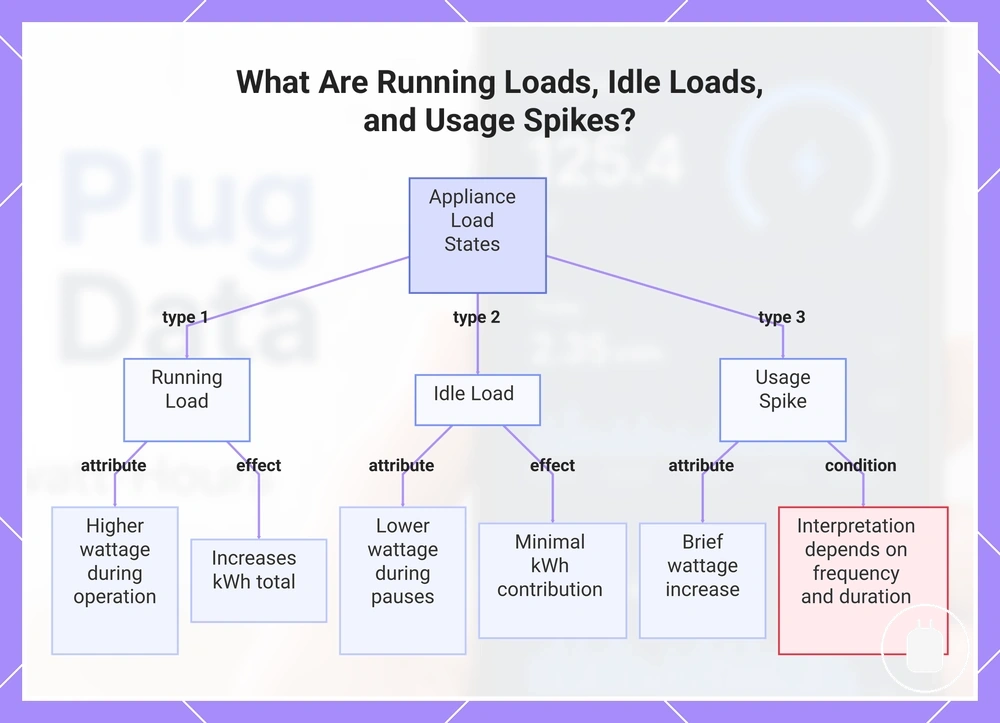
Running loads, idle loads, and usage spikes describe different appliance states that create different wattage behaviour. These load shapes show how a smart plug reading can change based on active operation, low-power periods, or short increases during certain moments of use.
Each appliance state can create a different reading shape. The state, wattage behaviour, duration, and effect on the kWh total help explain how each local load pattern should be interpreted.
- Running load: An active appliance state may show a higher wattage reading while the appliance is operating for a period of time.
- Idle load: A paused or waiting appliance state may show lower wattage behaviour during periods of limited activity.
- Usage spike: A brief increase in wattage may appear during startup or a mode change and should be interpreted with the appliance state, frequency, and duration in mind.
A repeated unexpected spike may need additional context before interpretation. The meaning depends on how often it occurs, how long it lasts, and the appliance behaviour during that period.
This chart shows the three main appliance load states—running, idle, and spike—and how each affects wattage behavior and kWh totals.
How to Compare Usage Across Time Periods
Comparing smart plug usage across equivalent time periods helps identify meaningful changes in appliance energy use without treating every difference as a direct cause. A baseline period and a comparison period should represent similar conditions so changes in kWh total, usage frequency, and operating condition can be interpreted more clearly.
A useful comparison matches the time ranges being reviewed and considers how the appliance was used during each period. The baseline period provides the reference point, while the comparison period shows the directional change. Differences in usage frequency, duration, or operating condition can affect the result, so a change should be interpreted with its surrounding context.
The table below compares the main factors to match when reviewing usage across equivalent time periods.
| Comparison factor | What to match | Why it matters |
|---|---|---|
| Baseline period | A similar previous usage period | Creates a reference point for understanding change |
| Comparison period | A similar current usage period | Helps identify directional changes in the kWh total |
| Operating condition | Appliance use frequency and operating state | Helps separate normal variation from a change worth checking |
When Usage Readings Need Checking
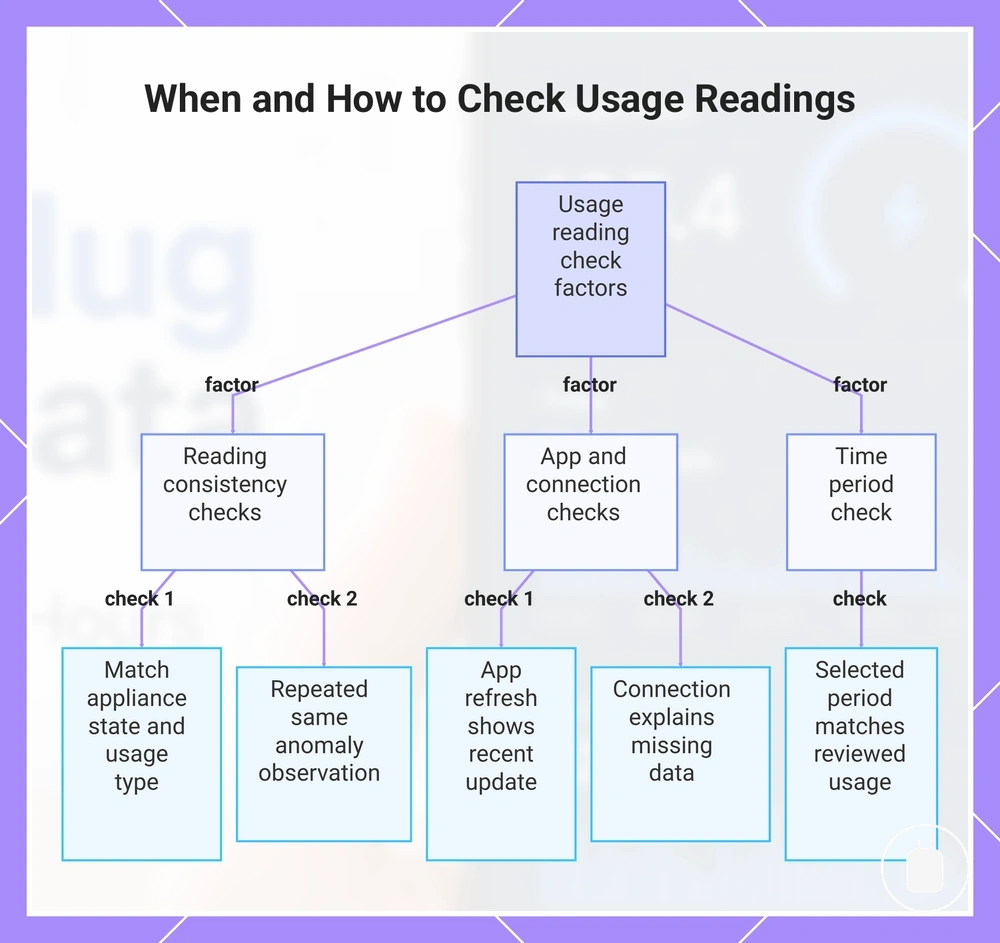
Unusual usage readings do not always indicate a fault, but inconsistent readings may need checking when they do not match the appliance behaviour being observed. A one-off anomaly can differ from repeated inconsistency, so checking the surrounding conditions helps separate an unusual reading from a reading that requires further investigation.
Usage readings should be reviewed alongside the reading value, appliance state, app refresh, connection status, and time period. An app refresh delay can make a reading appear stale, while missing data may relate to connection status or the selected time period. Repeated inconsistency provides more reason for checking because the same mismatch appears across multiple observations.
Questions about the accuracy of readings depend on the conditions of measurement and how the usage information is collected and displayed.
When usage readings need checking, review these factors:
- Reading value: Check whether the value matches the appliance state and the type of usage being observed before treating it as an implausible value.
- App refresh: Check whether the displayed reading reflects a recent update or an earlier appliance state.
- Connection status: Check whether missing data or a data gap may relate to the connection between the smart plug and app.
- Time period: Check whether the selected period matches the usage being reviewed.
- Repeated inconsistency: Check whether the same unusual reading appears repeatedly rather than as a one-off anomaly.
After these checks, wrong readings can be considered in more detail when a reading continues to appear inconsistent with appliance behaviour and the surrounding conditions.
This chart outlines the key factors to review when usage readings appear unusual or inconsistent.